
By office analytics: meeting rooms
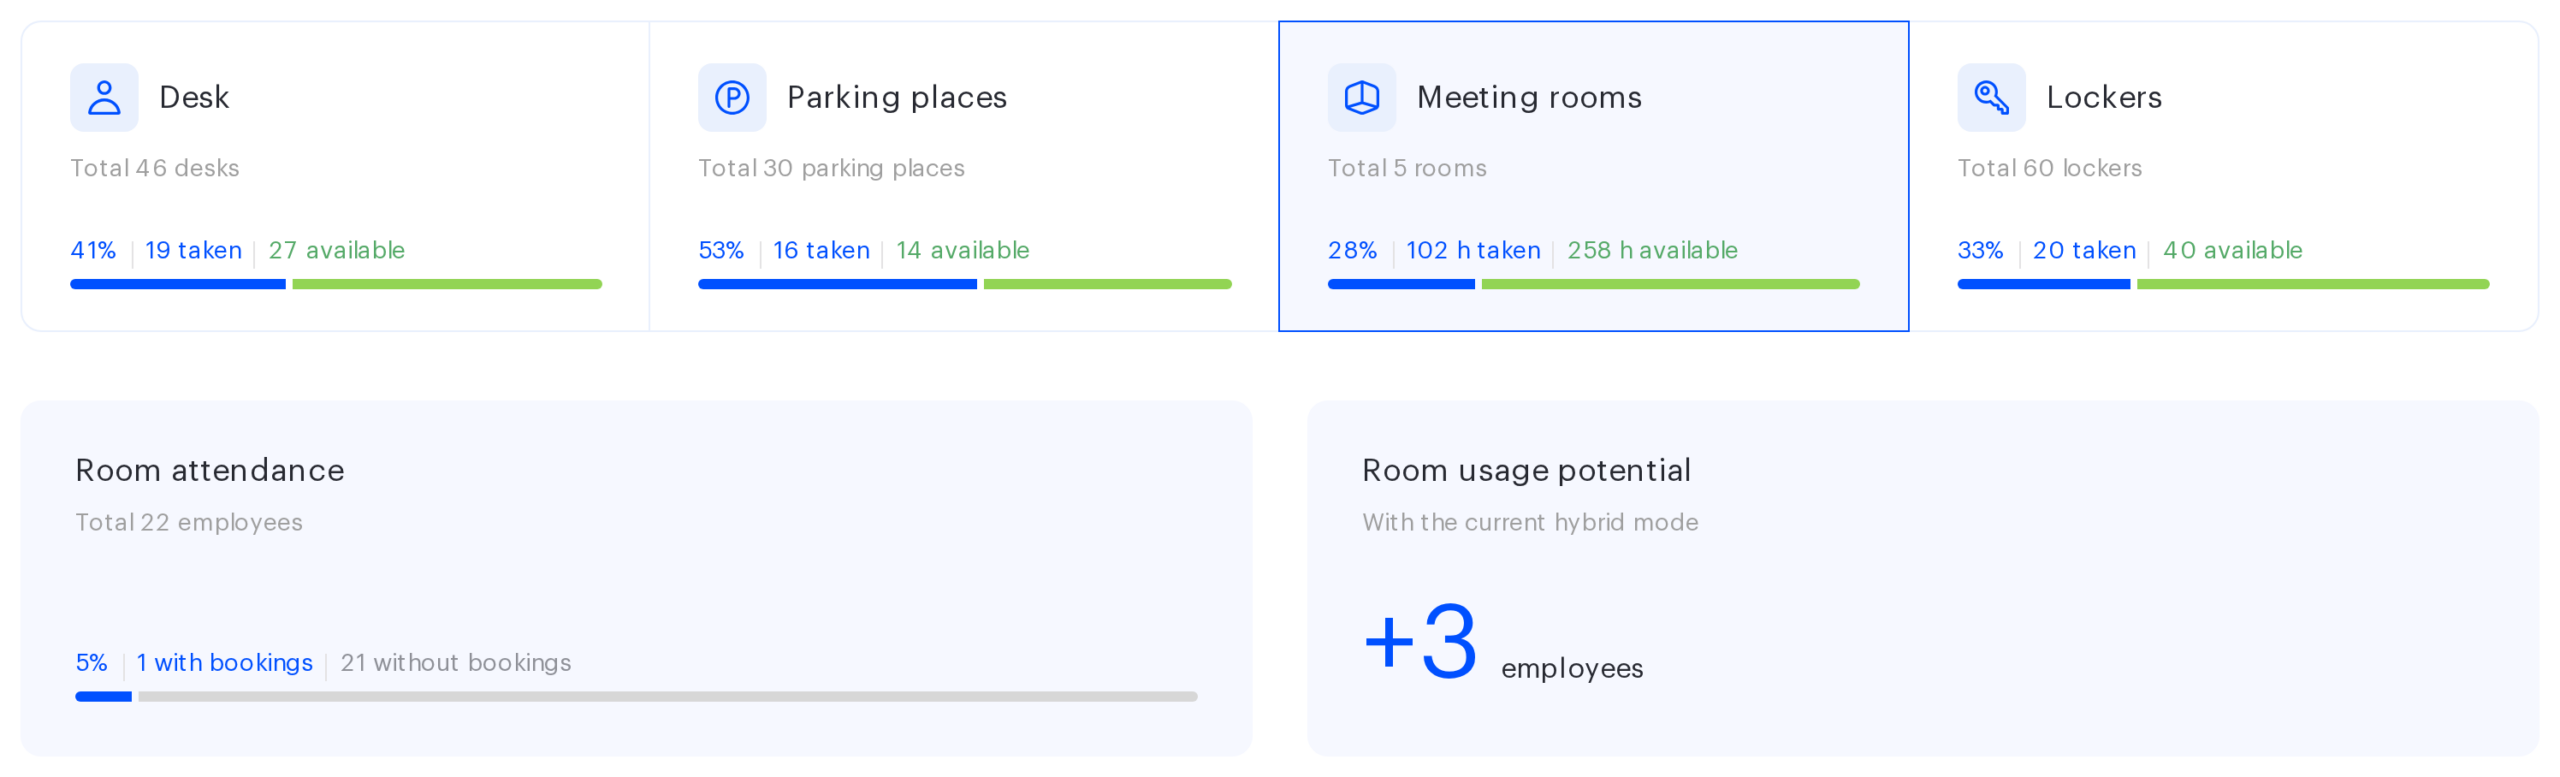
The Meeting rooms tile on the By office tab shows how densely the rooms are occupied, how long the meetings employees hold usually are, and which hours the demand for rooms peaks at. The set of blocks here differs from desks: hours are counted instead of places, a heat map takes the place of the trend chart, and the pie chart splits meetings by duration rather than places by type.
The tile counts hours
This is the first thing to understand about the tab: unlike desks and parking, where places are counted, the unit of measurement here is time. The tile can read Total 5 rooms and 180 h taken, 720 h available at the same time — the numbers refer to different things.
| On the tile | What it means |
|---|---|
| Total N rooms | How many meeting rooms got into the selection made by the By resources filter |
| The large percentage | The share of booked time out of all the available room time over the period |
| N h taken | The total duration of all bookings, trimmed to the company working hours |
| N h available | What is left of the available time |
What available time is. It is the number of rooms multiplied by the length of the company working day and by the number of working days in the period. The working day comes from the company defaults, and non-working days from the public holiday calendar are left out of the calculation.
Two practical consequences follow:
- The part of a meeting that falls outside the working day is not counted. A meeting from 17:30 to 19:00 with a working day ending at 18:00 counts as half an hour.
- A meeting scheduled on a day off does not reach the tile workload — non-working days are excluded from its calculation. (Such meetings do still show on the Average workload by day of the week chart and on the heat map — see those sections below.)
If the company has no meeting rooms, or the By resources filter narrowed the selection to zero, the tile goes grey and reads This resource is not in use.
Room attendance
The Room attendance block answers the question about people: how many employees from the selection booked meeting rooms over the period.
- Total N employees — the size of the selection made by the By employees filter.
- N with bookings — employees who had at least one room booking over the period. Unique meeting organisers are counted, not attendees.
- N without bookings — the rest of the selection.
An important detail. The metric counts the meeting organiser. If a booking arrived from an external calendar and its organiser is not resolved in UnSpot, the time of that meeting reaches the room workload but not the attendance. In companies with active calendar synchronisation this can produce a picture where the rooms are busy while with bookings shows few people or none at all. Besides, only meetings on working days are counted, and only the part of them that falls within the company working hours: the organiser of a meeting on a day off or entirely outside the working day does not reach with bookings. Cancelled bookings and bookings released automatically for a missed check-in are not counted.
Room usage potential
The block shows a number such as +12 with the caption employees and the note With the current hybrid mode. It means how many more employees could be holding meetings if the free room time were used as intensively as the booked time already is.
It is calculated as the free time multiplied by the number of employees with bookings and divided by the booked time. If there were no bookings over the period, the value is zero.
Since the number of employees with bookings takes part in the calculation, this block is affected by the same detail as attendance: bookings with no resolved organiser pull the result down.
Duration of meetings
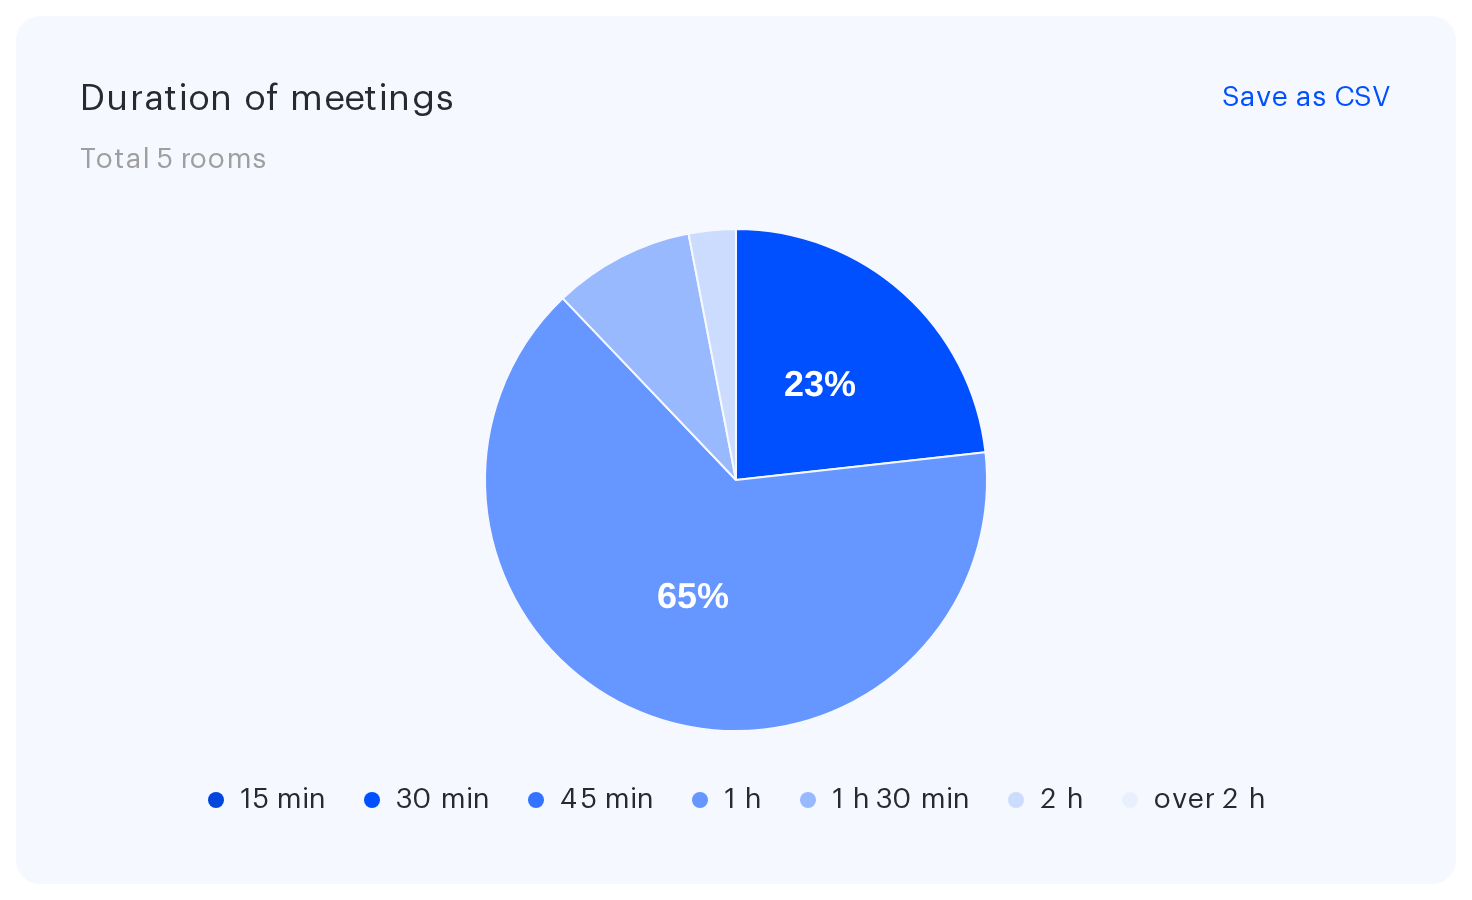
This pie chart sits where Average workload by desk sits for desks. It answers the question of how big the meetings held in the company are, splitting every booking of the period into seven duration buckets.
| Segment | Which bookings fall into it |
|---|---|
| 15 min | Meetings up to and including 15 minutes |
| 30 min | From 16 to 30 minutes |
| 45 min | From 31 to 45 minutes |
| 1 h | From 46 to 60 minutes |
| 1 h 30 min | From 61 to 90 minutes |
| 2 h | From 91 to 120 minutes |
| over 2 h | Anything longer than two hours |
The key difference from the desks pie chart: the shares here are shares of the number of bookings, not of time. An over 2 h segment at 10 % means every tenth meeting ran longer than two hours — not that such meetings took 10 % of the room time. Measured in time, long meetings always weigh more than this chart suggests.
Bookings on working days are counted, trimmed to the company working hours. Hovering over a segment shows its share as a percentage.
Average workload by day of the week
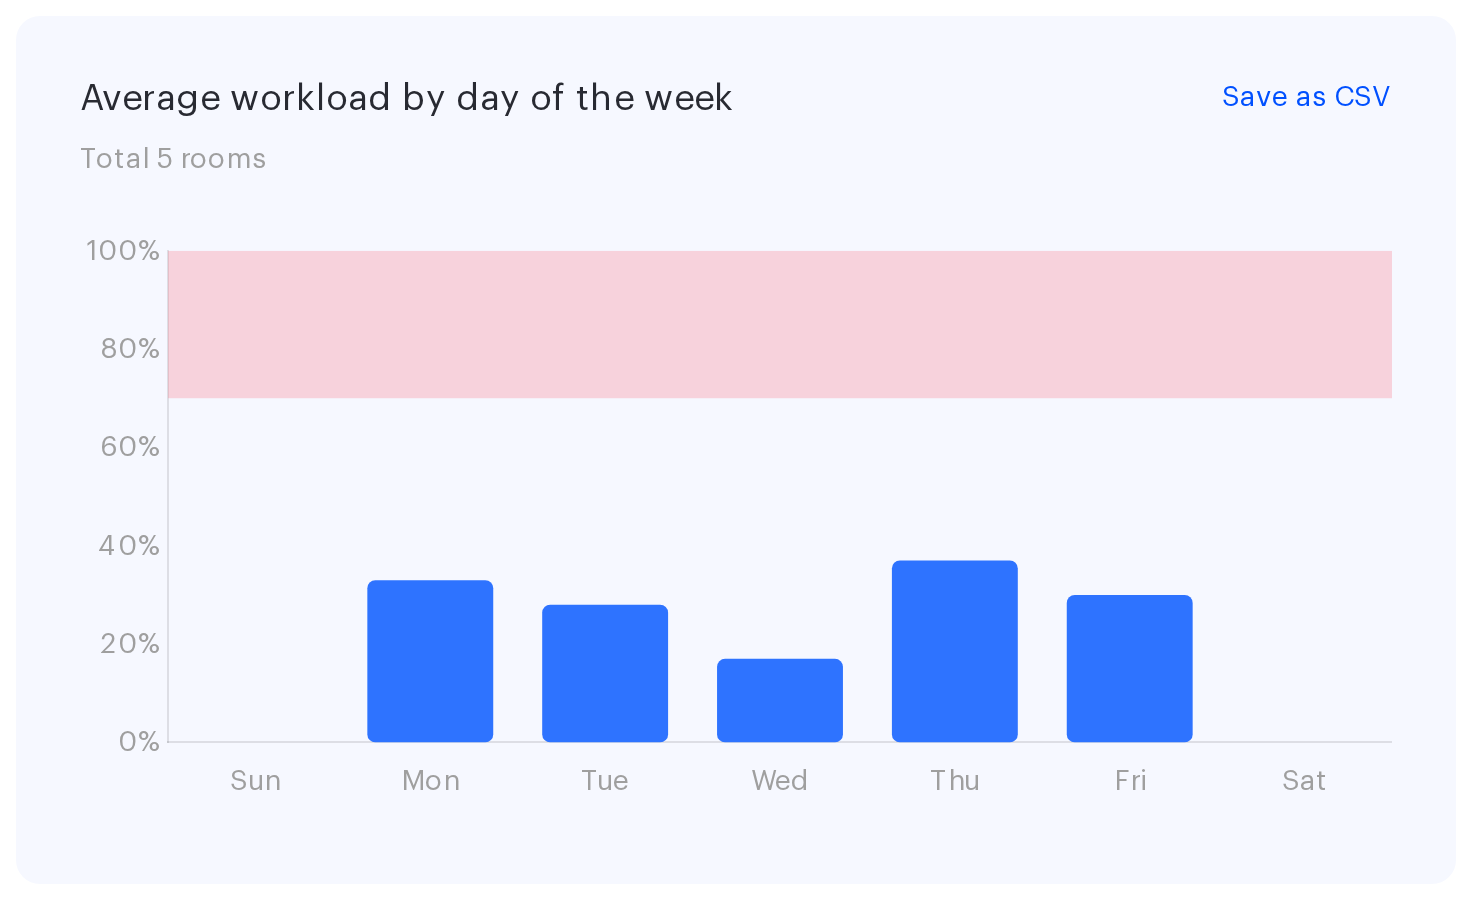
The heading is the same as for desks, but the chart is different. There are three distinctions:
- The value axis shows percentages of available time, from 0 to 100, not a number of places.
- Each column is solid, with no split by type: time has no assigned or unavailable statuses.
- A high-usage zone from 70 to 100 % is highlighted across the chart. A column reaching into that zone means the rooms are close to their limit on that day and employees already struggle to find a free slot.
Each column is calculated by taking every date of that weekday in the period, summing the booked time and dividing it by the total available time of those dates. The order of the days follows the company The first day of week setting. Hovering over a column shows the hint booked N% out of available time.
The heat map of meeting room usage
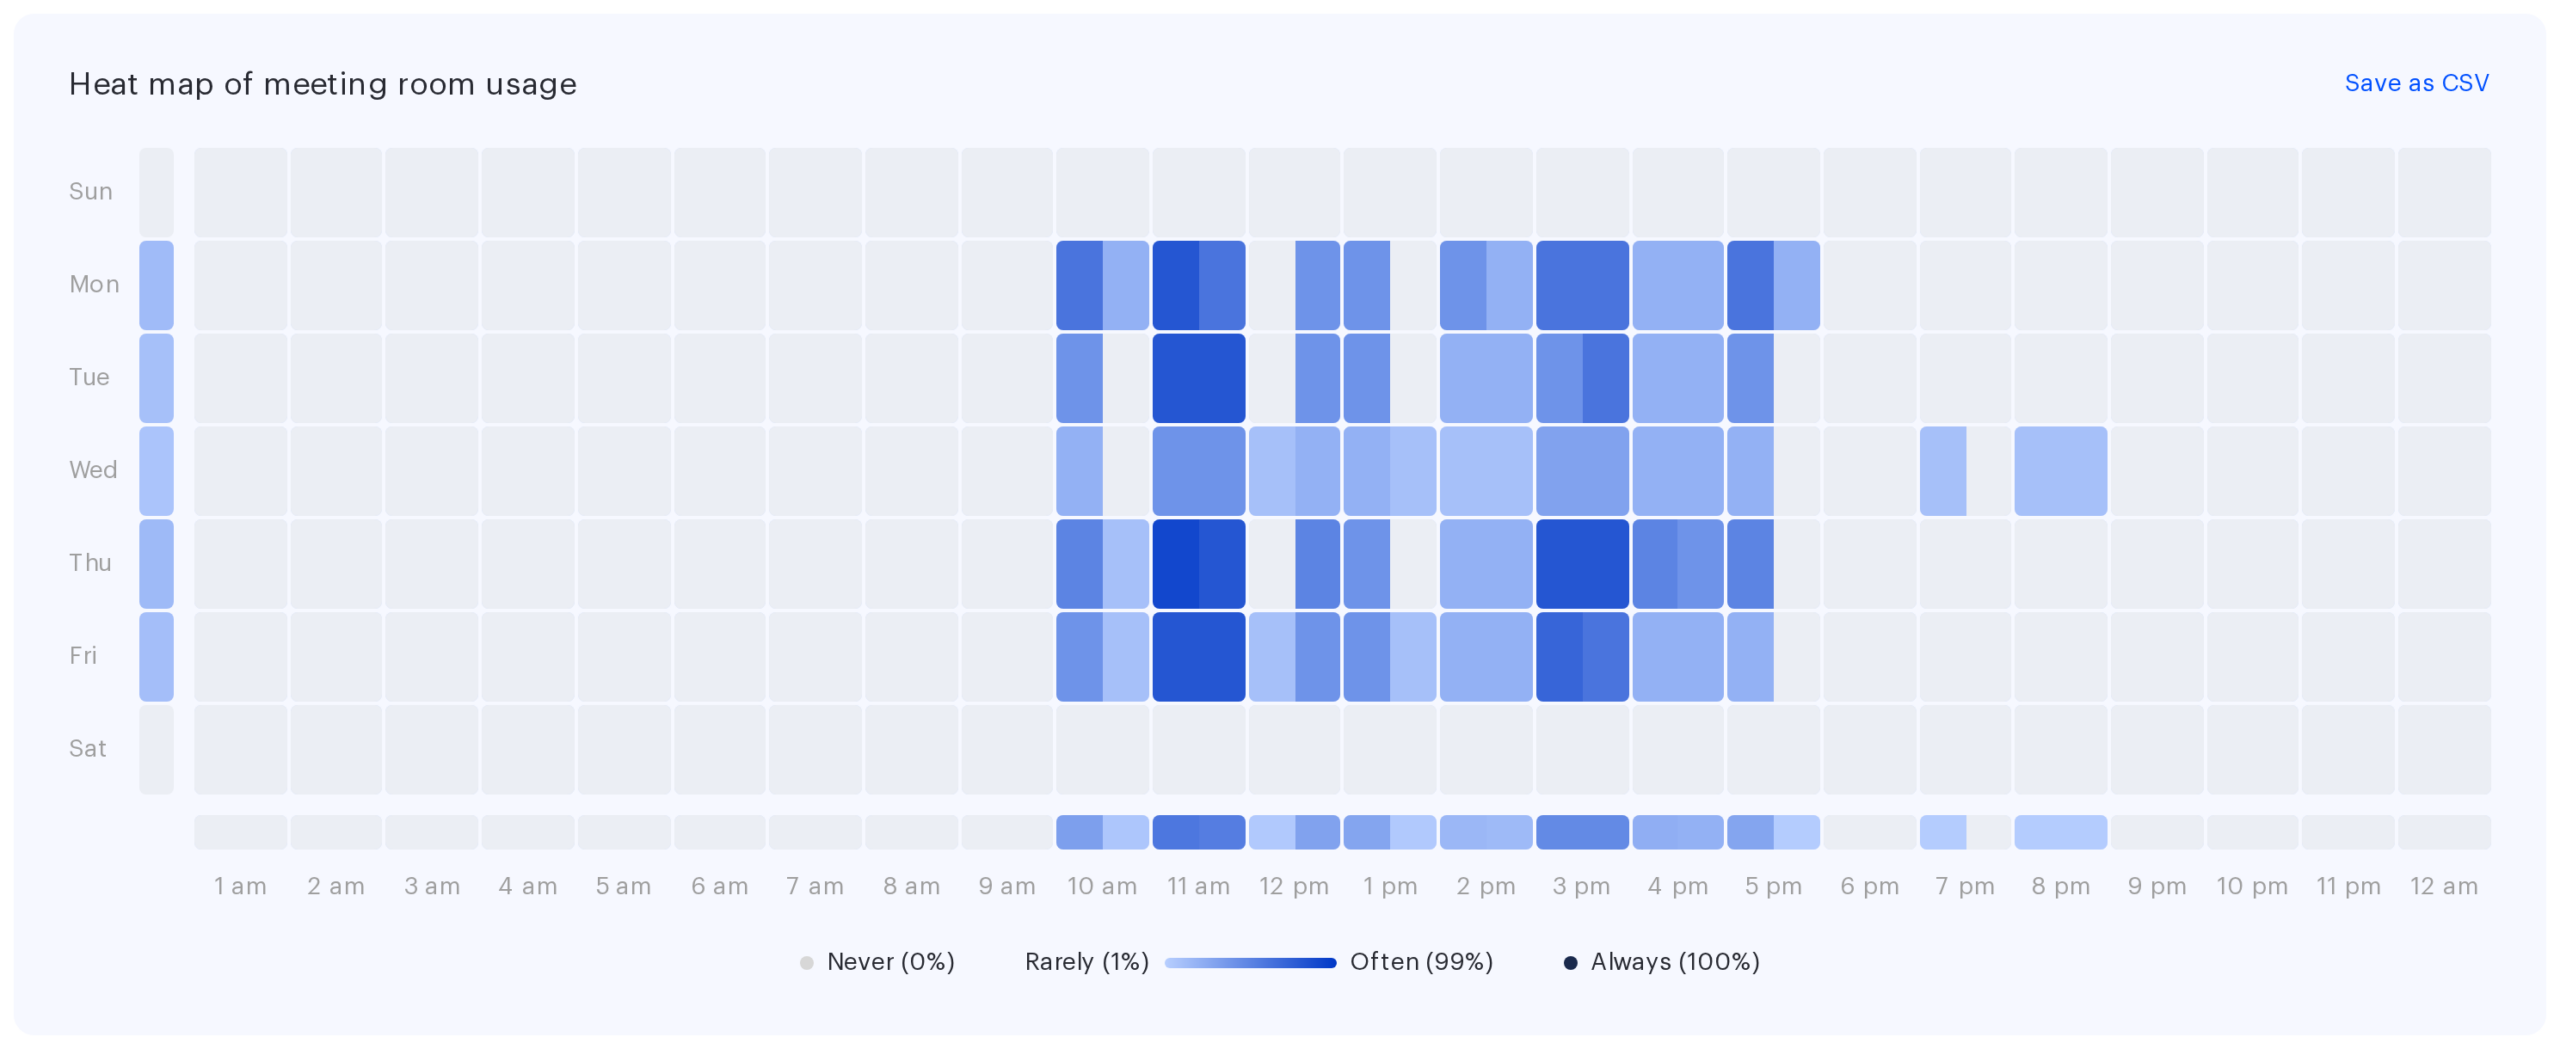
The most detailed block of the tab and the only one on the whole page that shows the distribution within a day. It spans the full width and answers the question of which exact hours meeting rooms run short.
It is laid out like this:
- Rows — the seven days of the week, ordered from the company first day of the week.
- Columns — the 24 hours of the day, each made of two half-hour cells. 48 cells per row in total.
- The cube to the left of a row — the summary value for that whole day.
- The bottom row — the total across all days of the week together.
The colour of a cell shows the share of occupancy: the darker it is, the higher the share. The legend under the map explains the extremes.
| Legend label | What it means |
|---|---|
| Never (0%) | Not a single booking fell into this half-hour over the whole period |
| Rarely (1%) | Isolated bookings |
| Often (99%) | Occupied almost always |
| Always (100%) | Every room was occupied in every such half-hour of the period |
How a cell is calculated. The denominator is the number of possible room half-hours: the number of rooms multiplied by the number of such weekdays in the period. The numerator is how many of them were occupied. A cell counts occupied room half-hours, not the number of bookings: one room in one half-hour of one date counts once, however many bookings overlap in it and however many hours in a row the meeting runs. The heat map is built from every booking, without trimming to working hours and including non-working days — it is the only block where the part of a meeting outside the working day is visible. Hovering shows a hint such as booked 40%, 8 out of 20 h.
What it is good for: a dark vertical band in the morning hours means those slots are taken and a new meeting cannot be placed there — even though the average workload for the day may look moderate.
How this differs from the Meeting Rooms tab
The analytics section has a separate Meeting Rooms tab, and it is easy to confuse the two. The difference is the level of detail:
| The Meeting rooms tile on the By office tab | The separate Meeting Rooms tab | |
|---|---|---|
| What it shows | The summary picture across every room of the selection at once | The workload of each room individually |
| Which question it answers | Whether the company has enough meeting rooms and at which hours | Which rooms are overloaded and which sit idle |
| Breakdown by time of day | Yes — the heat map | Its own logic, see the separate article |
A practical rule: planning how many meeting rooms the office needs — look here; working out why one particular room is always busy — go to the separate tab.
CSV export
The Download CSV button is available on three blocks of the tab:
| Block | Columns in the file |
|---|---|
| Duration of meetings | The duration bucket name and Booked (%) — one row per each of the seven buckets |
| Average workload by day of the week | Days of the week, Booked (hours), Booked (%) |
| Heat map | A time column, then a pair of columns per day of the week such as Mon (hours) and Mon (%), followed by a trailing average pair Hours / Percent; 48 rows by half-hour |
The tile, Room attendance and Room usage potential have no export. A Filters block with the period, the selections and the data source goes into the header of every file.