
By employees analytics: overview
The By employees tab is the analytics of people’s work schedules laid out along the organisational structure. It answers the questions “how diligently do departments keep their schedules”, “how are office, remote and non-working days distributed within a department” and “who is short of the required office days”. Unlike the By employee tab, it looks at a department, its direct employees and its subordinate departments rather than at one person; unlike By office, it counts days in employee schedules rather than resources. This article is the entry point: who can see the tab, how the page is organised, what is set in the parameters window, and which article covers each chart in detail.
What you need
Open Analytics → By employees. The tab is the third one in the tab bar of the section, after Reports and By employee. In the mobile version it sits in the Analytics menu as the By employees item. The page address is /analytics/by-employees.
The tab is shown to a Super Administrator, an Office manager and an Integrations Administrator. An Offices Administrator and a Users Administrator do not see the tab in the bar, but the page opens for them by its direct address. A regular Member, including a department manager without an administrative role, is not admitted: the direct address redirects them to the start page, even if their user card has Subordinates set to All users.
The amount of data depends on user permissions: if the viewer is not allowed to manage all users, only the employees available to them and the viewer themselves are counted. Devices (the accounts of meeting rooms and displays) are not included in the statistics.
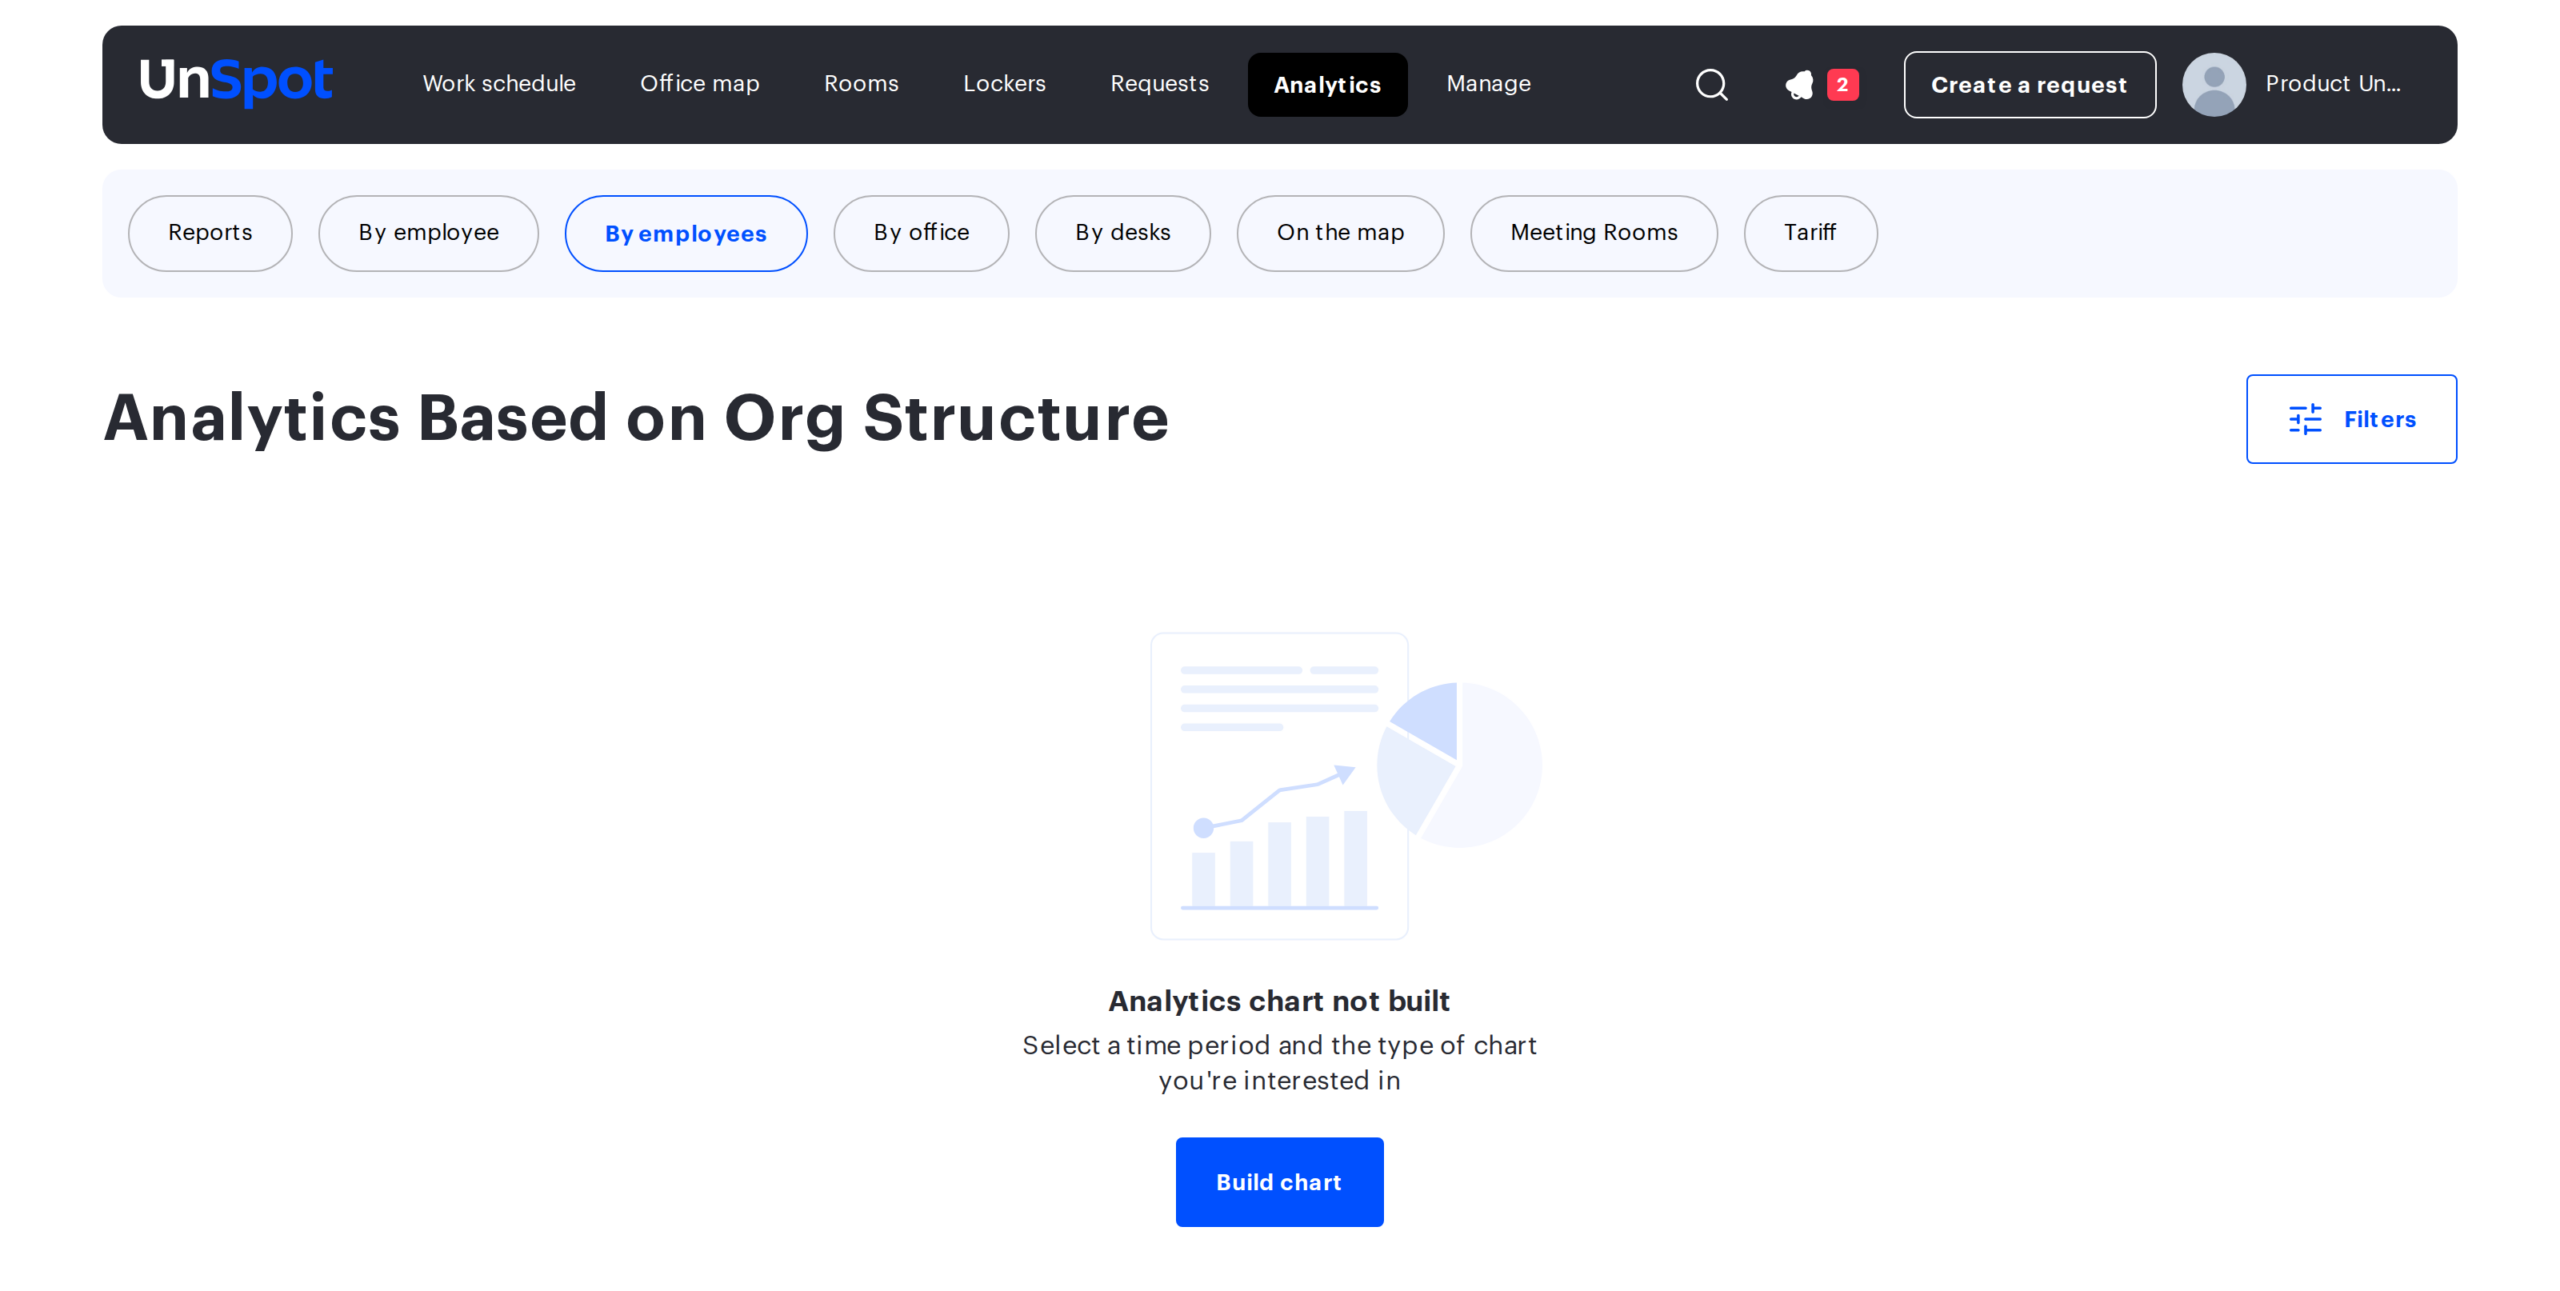
Unlike the neighbouring tabs, the analytics is not built automatically when the page opens. Until a chart type is selected, the page shows a placeholder. The period is already set by default: four weeks back up to and including yesterday.
How it differs from the neighbouring tabs
The Analytics section has three tabs with similar names, and each counts a different thing.
| Tab | Subject | Unit of counting | Question it answers |
|---|---|---|---|
| By employees | people’s schedules along the org structure: a department, its direct employees, its subordinate departments | working days of employees | how a department keeps its schedule and meets the attendance rate |
| By employee | one selected person | working days of one employee | how a specific employee attends the office and books desks |
| By office | company resources: desks, parking, meeting rooms, lockers | places and hours | whether the office is big enough and how busy it is |
The three charts of the By employees tab — Schedule completion tracking, Employee Work Schedule and Attendance Rate Control — match the blocks of the same meaning on the By employee tab. The difference is that here they are built for a whole department at once, and every row of the chart is a separate employee or subordinate department.
Which question goes where
| Question | Chart type | In detail |
|---|---|---|
| Who in the department does not fill in the schedule | Schedule completion tracking | The three charts and how they are calculated |
| How office, remote and non-working days are distributed in the department, including the company’s own statuses | Employee Work Schedule | The three charts and how they are calculated |
| Who is short of the required office days and by how many | Attendance Rate Control | The three charts and how they are calculated |
| What the picture looks like by work mode — office, hybrid, remote, flexible | Attendance Rate Control, Block 1 | The three charts and how they are calculated |
| How to narrow the analytics down to a department or an office | The Build analytics window | this article, the section about the parameters window |
| The picture for one person with a day-by-day calendar | another tab | By employee |
| Desk and meeting room workload | another tab | By office |
How the page is organised
Before the first build the page is a landing page: there is nothing on it except a heading, a button and a placeholder.
- The heading reads Analytics Based on Org Structure. Once a chart is built, the heading changes to the name of the selected chart type.
- The Filters button on the right of the header opens the Build analytics window. While the org structure and the list of offices are loading, the button is disabled.
- The placeholder with the text Analytics chart not built and the hint Select a time period and the type of chart you’re interested in. The Build chart button under it opens the same parameters window.
After the parameters are saved, a description line with the current filters appears under the heading, followed by one to three blocks with chart bars. The blocks are covered in the section The three blocks of the page.
The Build analytics window
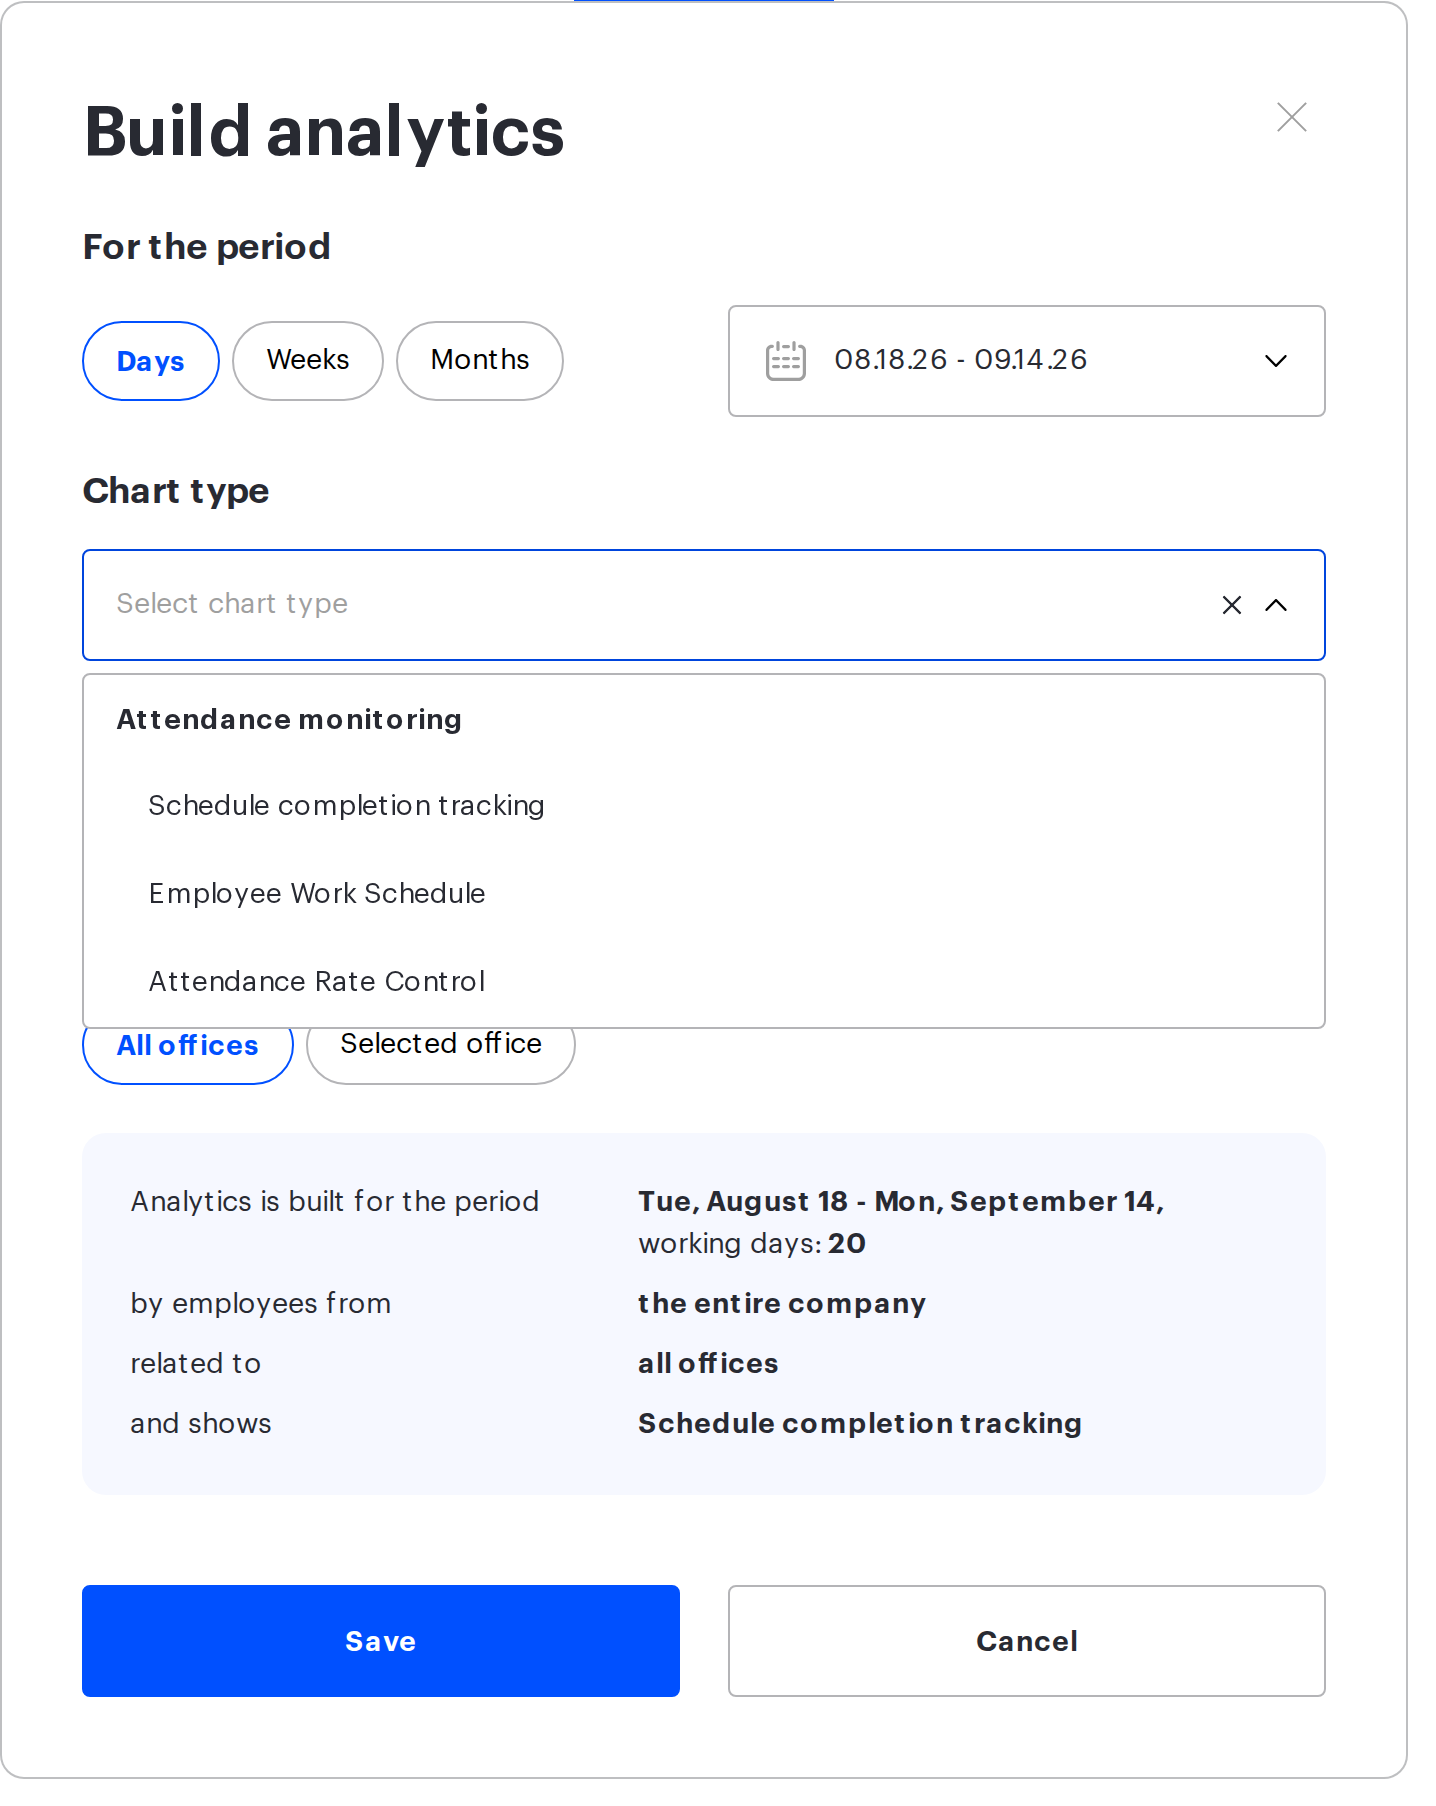
The window has four fields. Only one of them is required — the chart type; the others by default cover all employees and all offices.
| Field | Options | Rules |
|---|---|---|
| For the period | a calendar with the Days, Weeks and Months chips | defaults to four weeks back up to and including yesterday. No longer than three months: if you exceed it, the badge The reporting period cannot be longer than three months appears under the calendar and the Save button is blocked |
| Chart type | a searchable drop-down with the placeholder Select chart type. One group, Attendance monitoring, with three options: Schedule completion tracking, Employee Work Schedule, Attendance Rate Control | required: the window cannot be saved without a chart type |
| By employees | the All and By department chips; with By department, the Select department field | one department is picked from the org structure tree; with By department and no department selected the window cannot be saved |
| Related to | the All offices and Selected office chips; with the second one, the Select office field | one office from the tree; the offices nested in it are included. With Selected office and no office selected the window cannot be saved |
Changes are applied with the Save button; Cancel closes the window without recalculating. If a period longer than three months does pass the check in the window, a pop-up warning with the same text is shown instead of a chart and the page stays as it was.
The By employees filter defines whose schedule is counted: the entire company or one department with all the departments nested in it. The Related to filter additionally keeps only the employees whose user card has the selected office, or one nested in it, as the assigned office.
The description line
Both in the parameters window and on the page under the heading there is a line that gathers the current filters into one sentence. It always tells you what the figures are built for, without opening the window.
- Analytics is built for the period — the dates of the period and the working days: N counter.
- by employees from — the department name, or the entire company with the All chip. Until a department is picked, the grey hint select department is shown.
- related to — the office name followed by its parent office after a slash, or all offices with the All offices chip. Until an office is picked — the hint select office.
- and shows — the name of the chart type, or the hint select chart type until one is chosen.
The three blocks of the page
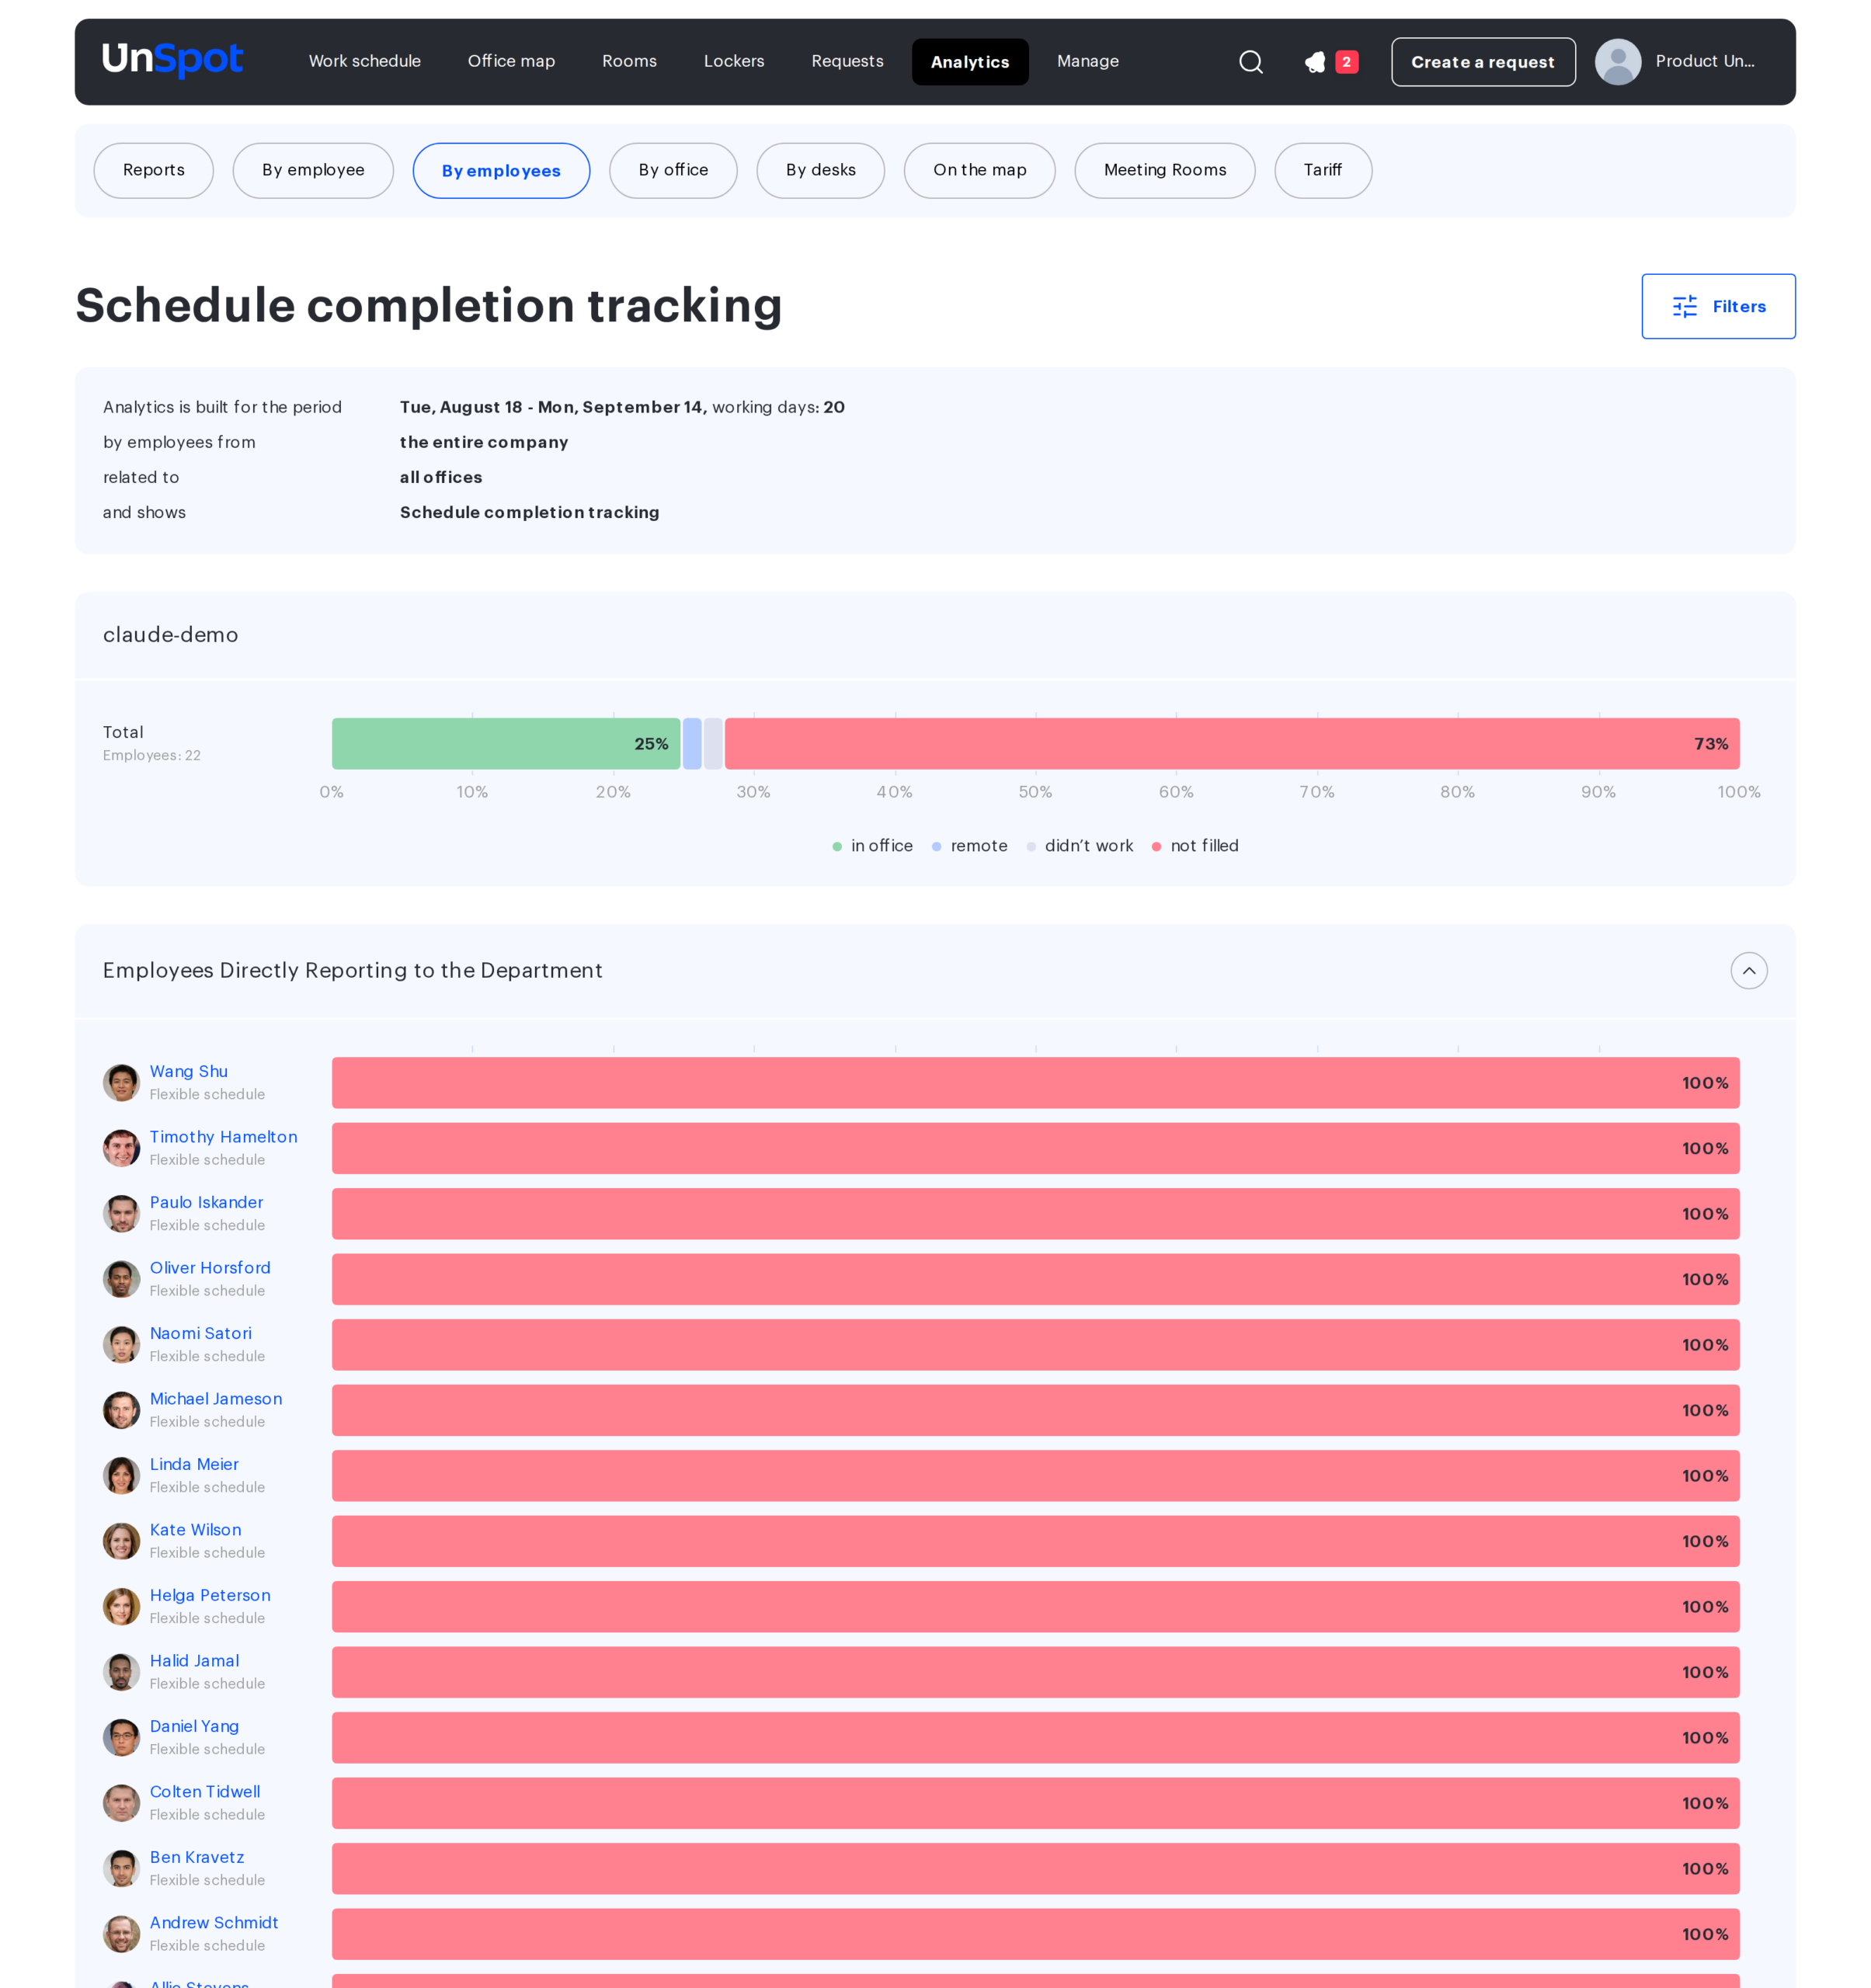
Each of the three charts is laid out in the same three blocks. Every block has a Total summary row with the Employees: N caption, a legend and — in the second and third blocks — an expandable list of rows.
| Block | Title | What it counts | Rows inside |
|---|---|---|---|
| Block 1 | the name of the selected department; with All — the company name | the whole department with all nested departments | in the schedule charts — only the Total row; in the attendance rate chart — four rows by work mode plus Total |
| Block 2 | Employees Directly Reporting to the Department | only the employees of the department itself, without nested ones; with All — employees who belong to no department | a row per employee: the name, the work mode under it (in the Attendance Rate Control chart this caption currently reads Flexible schedule for everyone and does not reflect the mode — a known defect), the chart bar |
| Block 3 | Employees from Subordinate Departments | first-level subordinate departments, each with all its nesting; with All — the root departments | a row per department: the name, Employees: N, the chart bar |
The row lists in Blocks 2 and 3 — and, in the attendance rate chart, the work mode rows in Block 1 — are collapsed by default. Only the Total row and the legend are visible at once; the arrow in the corner of the block expands the list. Only Block 1 of the schedule charts has no arrow — there is nothing to expand in it.
Rows are clickable. Clicking an employee’s name opens their side card — on the Schedule tab if the Work schedule section is enabled in the company, otherwise on the Information tab. Clicking the name of a subordinate department in Block 3 opens that department’s card in the org structure.
Which blocks are shown depends on the data. In Schedule completion tracking and Employee Work Schedule, Block 1 is shown only when there are both direct employees and subordinate departments; if there is only one of the two, only the matching block remains. In Attendance Rate Control, Block 1 is shown whenever there is any data. When a department has neither employees nor subordinate departments, the empty state is shown instead of the blocks.
What all charts have in common
All three charts are calculated the same way; only the set of statuses differs. The full breakdown with formulas is in The three charts and how they are calculated; here is what you need to read the numbers at all.
- Only working days are counted. Weekends and public holidays from the company’s work calendar are skipped, so the denominator of the percentages is the working days of the period, not its calendar length.
- The status of a day is taken by priority.
- The status set in the schedule cell.
- If there is none — a desk booking for that day, including the automatic booking of an assigned desk (counts as an office day).
- For dates from next week onwards — the schedule template (the office or status only if the template is enabled; a desk assigned in the template — always).
- If nothing is found — the day counts as not filled.
- Percentages and days are averages per employee. In a department row, “12 days (60%)” means “12 days per employee of the department on average”, not the sum across everyone. Percentages are rounded to whole numbers and adjusted to add up to exactly 100%.
- The tooltip on hovering over a bar starts with the line Total working days: N, followed by a coloured dot, the name and N days (P%) for every status. A segment 4% wide or narrower gets no percentage label inside the bar; the label is also hidden on a wider segment when the text does not fit into it (a narrow window, long rows). The value of a segment is always visible in the tooltip.
- An empty row (an employee or department with no working day in any status) is drawn with a grey background and the label 0%.
Empty state and export
If the selected department has neither employees nor subordinate departments, a block with the department heading (with All — the company name or no heading) and the text Nothing found — This department has no employees or subordinate departments. Try selecting another department — is shown instead of a chart. The Select department button under it opens the parameters window.
There is no CSV export on this tab — neither for the charts nor for the blocks. If you need the data as a file, use the Reports tab.
Limits and common misconceptions
- The analytics does not build itself. Until a chart type is selected, the page shows a placeholder; that is not a fault but a wait for parameters.
- The office filter selects by the employee’s assigned office, not by where they booked desks or marked themselves in the schedule. An employee with no assigned office is left out when the Selected office chip is used.
- In the Attendance Rate Control chart the office filter is currently not applied — the figures are counted across all offices, although the description line shows the selected office (a known defect). In Schedule completion tracking and Employee Work Schedule the filter works.
- A period of exactly three months may be rejected. The parameters window and the server count the boundary slightly differently, so an interval of three calendar months sometimes passes the check in the window but is rejected by the server with the same warning. The reliable option is an interval noticeably shorter than three months.
- “Days” in a department row is an average per employee, not a sum. Rows of departments of different sizes can be compared by days as averages, but not as totals.
- The future part of the period is a forecast. For dates from next week onwards that have neither a status in the cell nor a desk booking, the day is completed from the schedule template; in the current week the template is not used and such days count as not filled.
- Permissions narrow the selection silently. If you are not allowed to manage all users, the chart includes only the employees available to you, and Employees: N in Block 1 may be smaller than the department headcount.
- Mobile version. The tab is available as the By employees item in the Analytics menu; on a narrow screen the percentage label inside a segment is hidden already below 15% — use the tooltip.
- The current day is not part of the default period — it ends yesterday; today is added manually in the calendar.