
By desks analytics: filters, period and export
The report on the By desks tab is not built on its own: until a chart type is selected, the page shows a placeholder. All parameters live in a single dialog — period, org-structure scope, office scope and data source. This article goes through the parameters dialog field by field, explains the difference between the two data sources and describes the CSV export.
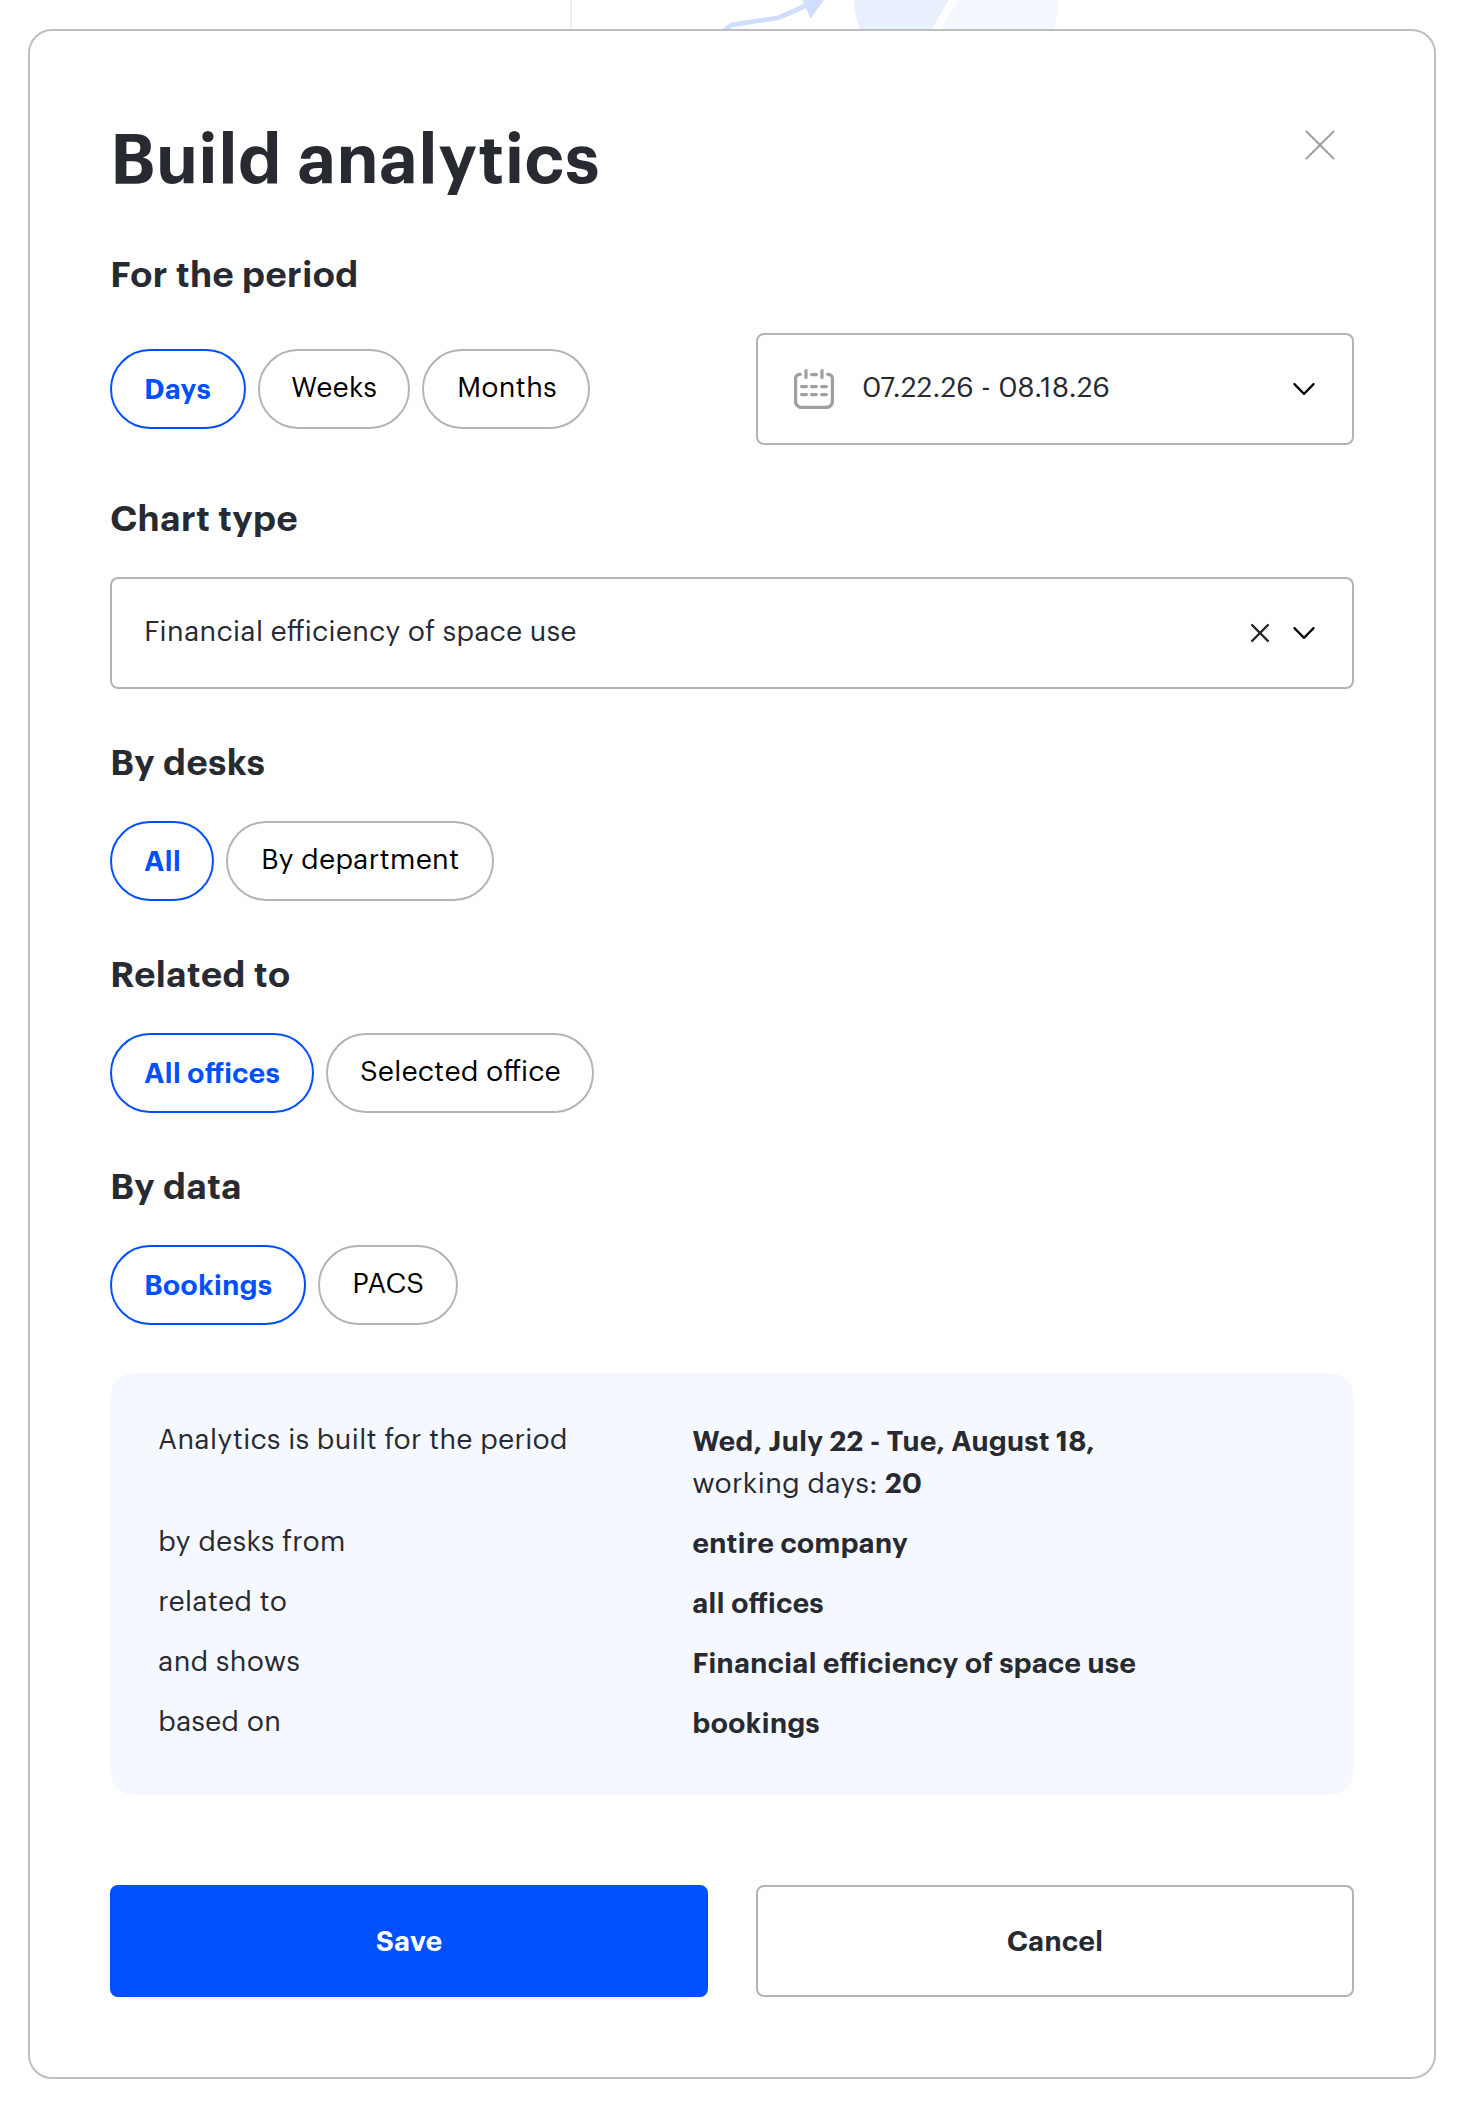
The parameters dialog
Open Analytics → By desks and press Filters. The Build analytics dialog has five blocks. They are applied with the Save button.
| Block | Options | Default |
|---|---|---|
| Period | a calendar with the chips Days, Weeks, Months | from “today minus four weeks” to yesterday |
| By desks | All or By department | All |
| Related to | All offices or Selected office | All offices |
| By data | Bookings or PACS | Bookings |
| Chart type | a single option, the field is mandatory | not selected |
Chart type
The Chart type field is mandatory, and while it is empty the page shows Analytics chart not built with the hint Select a time period and the type of chart you’re interested in.
Today there is one type available — Financial efficiency of space use in the Workload group. After it is selected, the page title changes from the generic Analytics Based on Org Structure to the name of the chart.
Period
The period is set in a calendar, with three grouping chips above it. Any click on a chip resets the dates you have already picked, so pick the chip first and the dates second.
| Chip | What happens when it is pressed |
|---|---|
| Days | the period is reset to today, the second date is cleared |
| Weeks | the period is reset to the current week, from the first day of the week set in the company settings (Monday or Sunday) to the seventh |
| Months | the period is reset to the current month, from the first day to the last |
⚠️ Weeks and Months set the period up to the end of the current week or month, that is, they include days that have not happened yet. Those days count as working days and land entirely in “not used”, understating the usage share. For an honest picture move the end of the period back to yesterday.
The period cannot be longer than three months. If it is exceeded, the message The reporting period cannot be longer than three months appears, the save button is disabled and no request is sent. The last day of the selected interval is included in the report; today is not included in the default period.
The thresholds of the window and of the server differ slightly: the parameters window disables Save only when the interval is strictly longer than three months, while the server counts the last day inclusively and already rejects “three months plus one day”. So an interval of exactly three calendar months (for example, 1 June to 1 September) passes the window but is rejected by the server, and the numbers on the page do not change. A reliable choice is an interval noticeably shorter than three months — two months, for example, or a quarter minus a week.
The number of working days in the period is derived from the production calendar and the company week template, both configured in the company settings.
Scope by org structure and offices
Two filters work together: the first picks the starting point in the org structure, the second narrows the selection down to offices.
- By department opens the department tree with single selection. The selected node becomes the starting point: its own desks go into the first block of the report, its first-level children into the second.
- All means counting from the company as a whole. ⚠️ In this mode the first block shows desks with no department, not every desk of the company.
- Selected office opens the office tree, also with single selection. ⚠️ Selecting a node includes all of its child nodes: pick a building and every floor and office inside it enters the selection.
⚠️ The department filter does not change the cost denominator. The daily price of a desk is always the office cost divided by all desks of that office, not only by the desks of the selected department. Why it works this way is explained in the overview article for the tab.
Data source: bookings or PACS
The By data chip switches not a filter but the whole calculation method. These are not two views of the same figures, they are two different reports.
| Bookings | PACS | |
|---|---|---|
| What counts as usage | days on which a particular desk had a booking | days of actual employee presence in the office, from access events |
| Breakdown by desk | every desk has its own usage share | the share is identical for every desk in the selection, including desks in different offices |
| Question it answers | which desks nobody uses | how much of the office is in demand at all |
⚠️ In PACS mode there is no per-desk statistics. The system takes the total number of employee-days from the access log and divides it by the number of desks multiplied by the working days — the result is a single demand share applied to every desk equally. If in this mode every row of the report shows the same percentage, that is not a defect.
⚠️ In PACS mode the office filter does not narrow the access data. The access log does not store the office, so the numerator is always taken across the whole company while the number of desks is taken for the selected office only. Because of that a filter on a single office inflates the usage share, which often runs into 100%. PACS mode is worth building across all offices.
With a department filter the two sides differ as well: access events are taken from the employees of that department and its descendants, while the desks are the ones assigned to the same subtree. An employee may well visit an office where their department has no desk at all.
PACS mode makes sense when booking is not fully adopted in the company and bookings do not reflect real attendance. Access events received from an integration and events uploaded from a file are both taken into account. More on the sources of access data is in By office analytics: PACS data.
The filter description line
Under the page title there is a line that repeats every selected parameter: the period the analytics is built for, the department the desks are taken from, the offices they are related to, what the chart shows and by which data. A working-day counter sits next to the period. The line exists so that an exported report or a screenshot can be read without opening the parameters dialog.
CSV export
The Download CSV button is available on every block of the report. The block whose button you press is the block that gets exported — the files for desks and for departments are different.
The file starts with a header that repeats the report parameters: a “Filters” line, then the period, the org-structure scope and the office scope. The table follows. ⚠️ The data source does not make it into the file header — the CSV gives no way to tell whether it was built on bookings or on PACS data, so label the export yourself.
| Column name | Format | What it contains and what for | Example |
|---|---|---|---|
| first one, no header | text | the name of the desk or the department; the row is matched to the on-screen report by it | Desk 12 |
| Number of desks | integer | how many workplaces stand behind the row; filled in for the total row | 30 |
| Total cost, currency | integer, no thousands separators | the cost of the row for the whole period; the currency label is inserted into the header from the company settings | 20000 |
| Used, currency | integer | the cost of the days on which the desk was booked | 8000 |
| Used, % | integer | the share of the days of usage; together with “Not used, %” it gives 100 | 40 |
| Not used, currency | integer | the cost of the idle time — the column the report is exported for | 12000 |
| Not used, % | integer | the share of the idle days | 60 |
The first row of the table is the TOTAL line, the rows of the block follow below. The currency label is inserted into the headers of the three money columns from the company settings.
- The file name is composed of the chart type name and the word Desks or Org unit. The Total block has the button too: such a file contains a single summary row, and its name is just the chart type name.
- ⚠️ The desks export has no office column and no grouping by office — only a flat list of names. Desks with identical names in different offices cannot be told apart in the file.
- All money values are rounded to whole units, so “used” plus “not used” may differ from the “total cost” by one.
- The separator is a comma. ⚠️ If a desk or department name contains a comma, the columns in such a file will shift — rename the object or open the file with an explicit separator setting.
- The file is saved without an encoding marker, so names with non-Latin characters may look garbled when the file is opened by a double click in a spreadsheet application. The reliable route is importing the file into a new sheet with UTF-8 specified.
Frequently asked questions
| Symptom | Cause |
|---|---|
| The Save button in the parameters dialog is inactive | the selected period is longer than three months |
| The dates you picked have disappeared | a grouping chip was pressed after the dates were chosen — it resets the period |
| The page shows “Analytics chart not built” | no chart type is selected, and the field is mandatory |
| One office was selected, yet extra desks entered the report | selecting a node includes all of its children: a building pulls in its floors |
| A department was selected, yet the first block is empty | the department has no desks of its own — they belong to its child departments, look at the second block |
| Every row shows the same percentage | the By data: PACS mode is on, where the share is common to every desk in the selection |
| The usage share is suspiciously high | PACS mode with an office filter: the access events are taken across the whole company |
| The columns in the CSV file have shifted | a desk or department name contains a comma |