
By employee analytics: office attendance and work schedule
Four of the six blocks on the By employee tab are built on a single source — the employee’s schedule. They answer the questions “how often is the person in the office”, “how are the working days distributed”, “is the schedule filled in diligently” and “is the office attendance rate being met”. This article covers each of the four blocks: what the bar shows, where the percentages come from and why the same days are counted differently in different blocks.
How a block is built
Five of the six blocks on the tab are assembled the same way: a title, a full-width horizontal bar and a legend underneath. The bar always fills 100% and is split into coloured segments; hovering over a segment shows a tooltip with absolute numbers. Most blocks have a round arrow in the top right of the card header that expands a calendar where every day of the period is filled with the colour of its status.
How many times per week the office is visited is built differently: it has neither a legend nor a tooltip, and its bar does not span the full width — the length of the bar is the share of office days among the working days of the period.
- Segments of 4% and smaller are left without a label — their value is only visible in the hover tooltip. On a narrow screen the threshold is higher: labels start to appear from 11%.
- The arrow stops responding on two cards only — How many times per week the office is visited and How often bookings are cancelled — and the triggers differ: on the first, when the schedule contains no day with a desk; on the second, when the booking log contains no counted day. Every other card expands even if the calendar behind it is empty, and Attendance Rate Control has no arrow at all.
- In the calendar, weekends override any status. The non-working day styling is applied last and paints over whatever was underneath.
- Days outside the selected period are shown in grey and are not clickable.
Two of the four blocks in this article are visible in any profile. The other two — Schedule completion tracking and Attendance Rate Control — are rendered only when you are looking at another employee’s profile; they are absent from your own.
How many times per week the office is visited
The block answers the question “how many days a week is the person in the office on average”. The label on the bar reads “N days per week”, with a ratio of the form “X out of Y” next to it.
| Value | How it is calculated |
|---|---|
| Office days | working days of the period in which the employee has a desk in the schedule |
| Number of weeks | working days of the period divided by 5 |
| Result on the bar | office days divided by the number of weeks, rounded to a whole number |
⚠️ A “booking” here means that a desk is attached to the day in the schedule, not a record in the booking log. The block only looks at whether a desk is assigned to the day and does not care how it got there — whether the employee booked it, the desk is permanently assigned, or the booking was created from a schedule template. That is why the numbers in this block do not have to match the block How often bookings are cancelled, which counts from the log.
There is one exception: a booking removed automatically by check-in drops out of the schedule, so such a day is not counted as an office day here — even though the cancellations block does record it as cancelled by check-in. Guest bookings never reach the schedule either.
⚠️ The number of weeks is always obtained by dividing by 5, regardless of the working week configured in the company. With a four- or six-day week the “times per week” average will be skewed.
Example. The period has 20 working days and a desk was in the schedule on 9 of them. The number of weeks is 20 ÷ 5 = 4, the average is 9 ÷ 4 = 2.25, so the bar reads “2 days per week” with the ratio “9 out of 20”. ⚠️ Rounding to a whole number hides the difference: 9 days give “2 days per week”, while 11 days already give “3 days per week” (11 ÷ 4 = 2.75). When you compare employees with each other, read the “X out of Y” ratio rather than the average.
Employee Work Schedule
The block breaks all working days of the period down by schedule status and shows the shares as percentages. The hover tooltip starts with the line “Total working days: N”, followed by one line per status with the number of days and the percentage.
There are four base statuses: in office, remote, didn’t work and not filled. If the company has defined its own schedule statuses, they appear as additional entries inside the matching base status, with their own names and colours from the company settings. Days without a custom status are collected into a separate remainder entry. As a result, the set of legend entries differs from company to company.
⚠️ The future part of the period is a forecast, not a fact. For dates from next week onwards that have no explicit status yet, the status is completed from the employee’s schedule template by three rules.
- An office day is configured in the template — the day counts as “in office”.
- A status is configured — that status is taken as is.
- A desk is assigned — the day counts as an office day too.
If you build a report that reaches into the future, remember that part of the bar describes intentions rather than behaviour.
Schedule completion tracking
The block is shown only in another employee’s profile and answers one question: how diligently the person maintains their schedule.
The data is the same as in Employee Work Schedule, but presented differently.
- Custom company statuses are not expanded — the legend has exactly four entries: in office, remote, didn’t work, not filled.
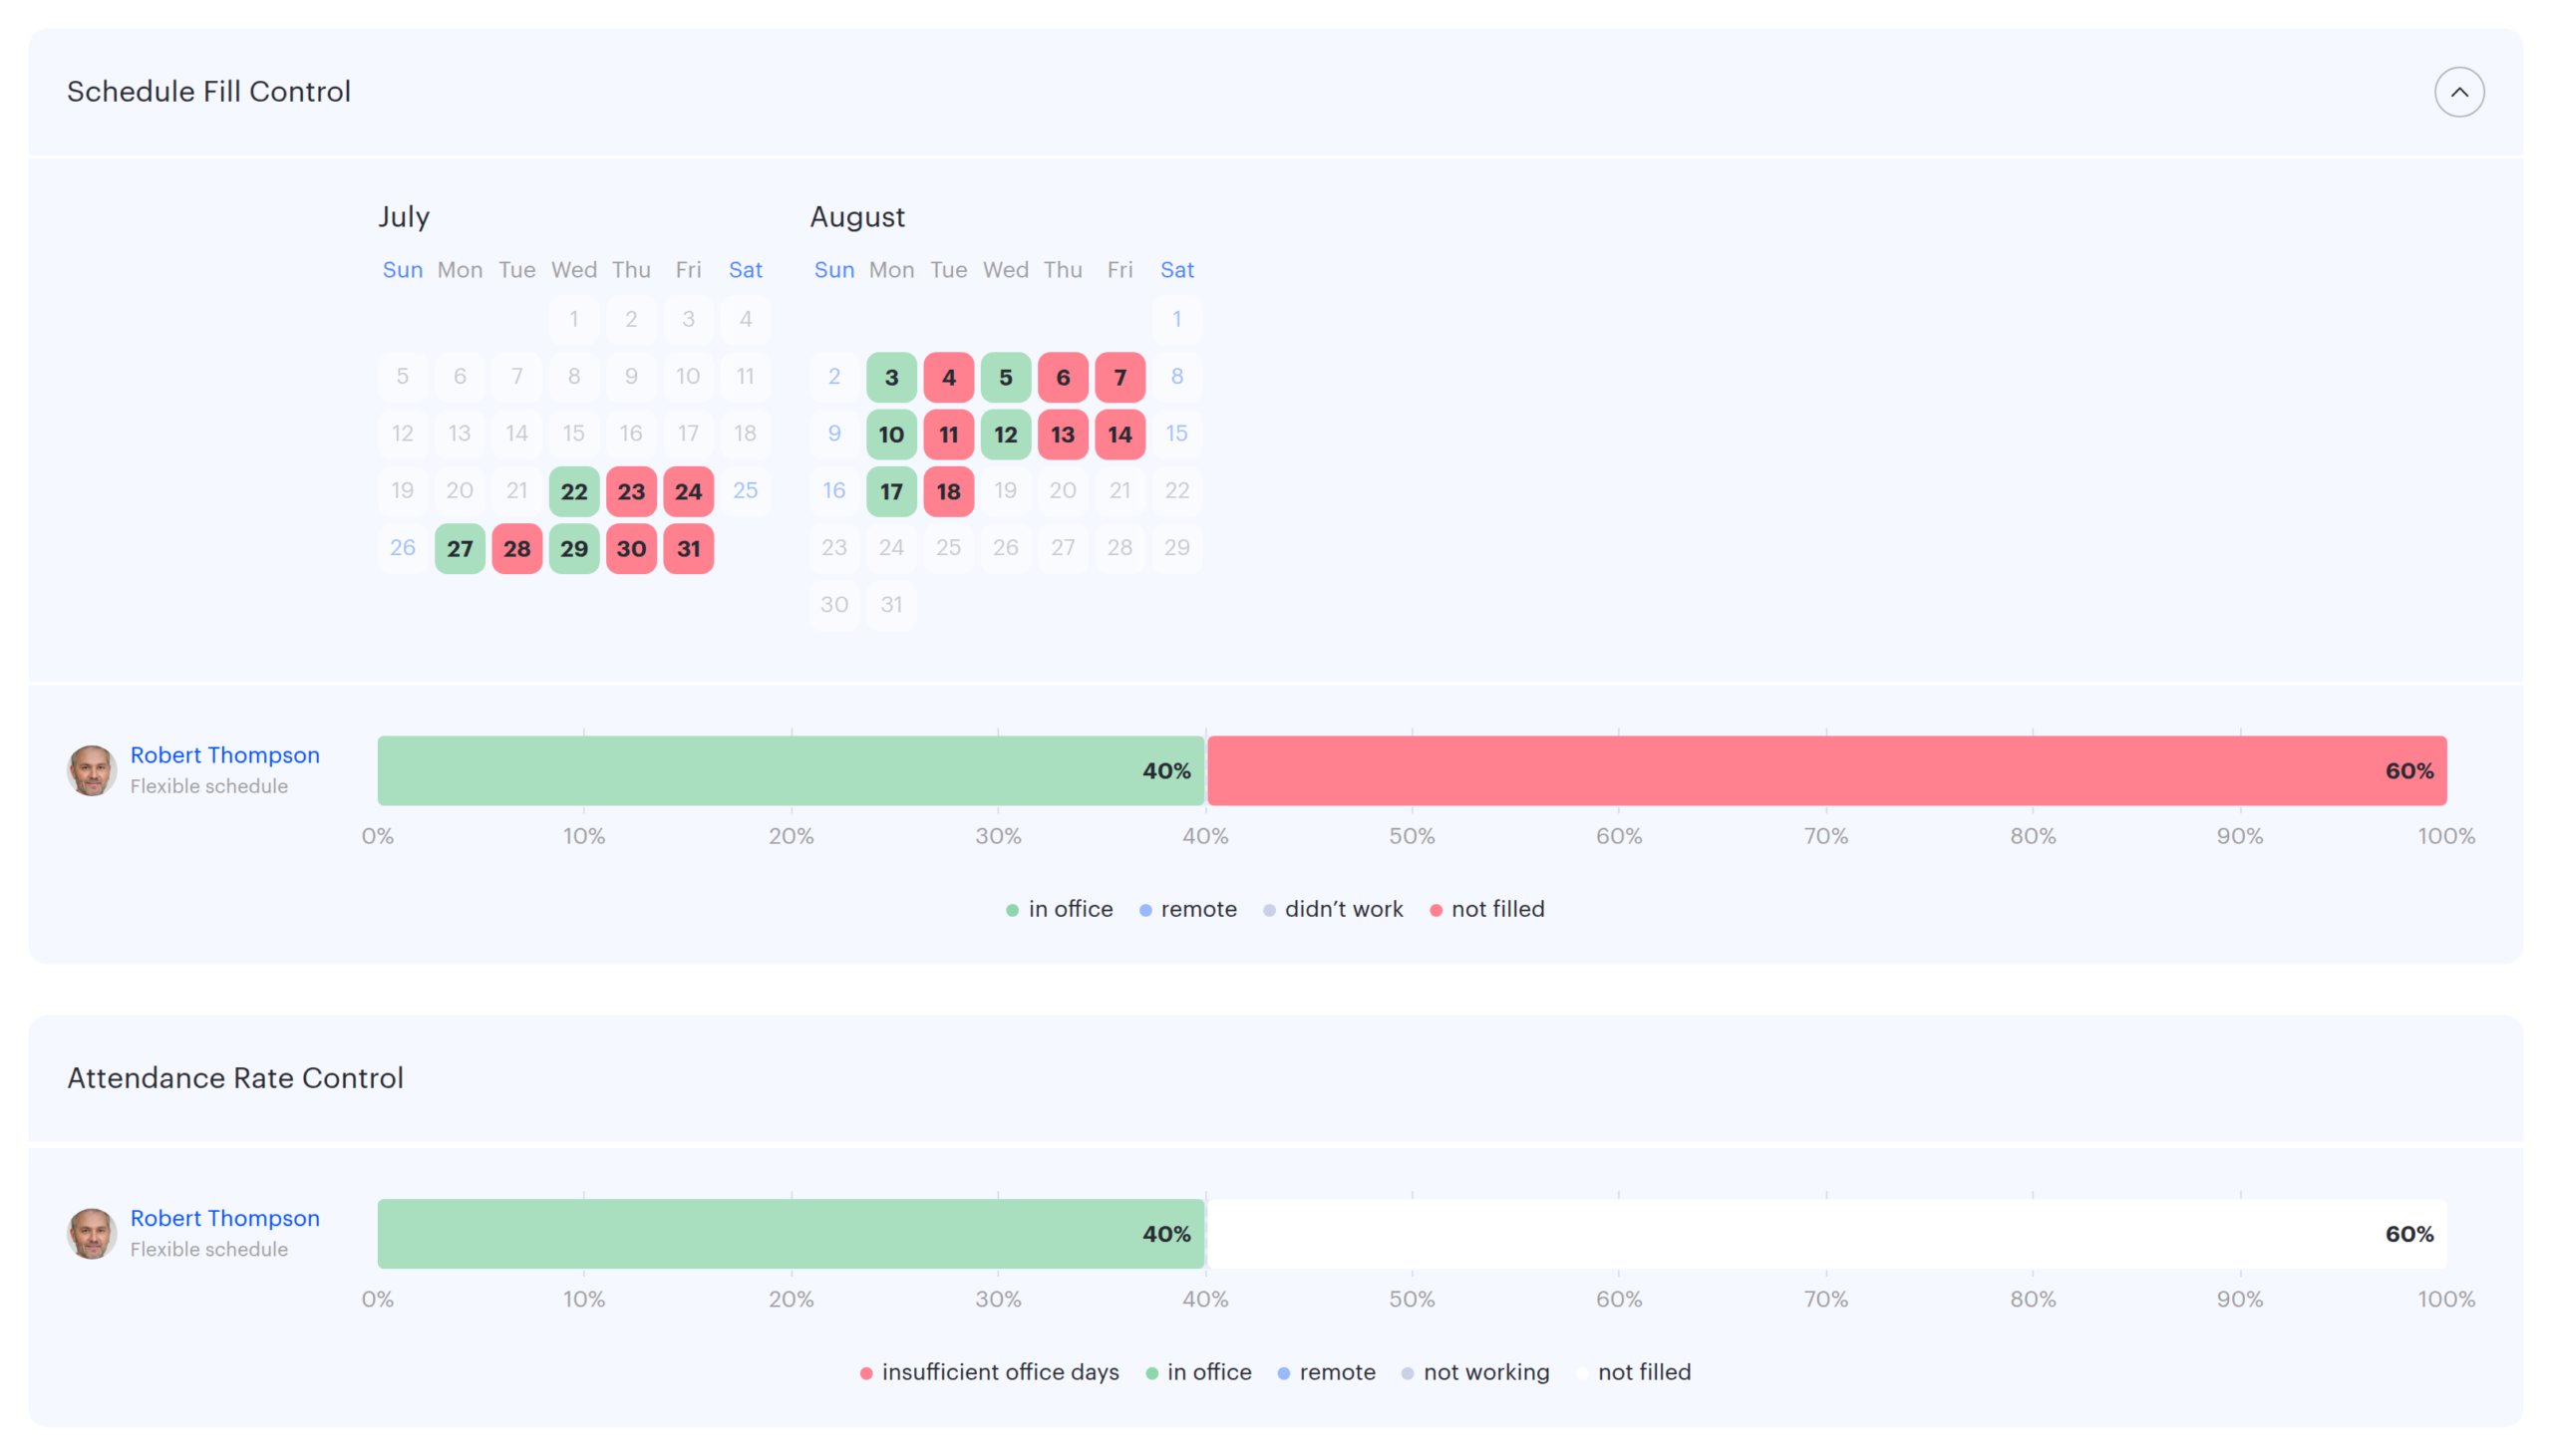
- Days that are not filled in are highlighted in red rather than white, both on the bar and in the calendar. That is the substantive difference between the two blocks: one describes the schedule, the other shows the holes in it.
The red share consists of days where the employee marked nothing at all: neither office, nor remote work, nor absence. Such days fall out of planning — the system does not know whether to expect the person in the office.
Attendance Rate Control
This block is also visible only in another person’s profile and shows whether the employee meets their personal office attendance rate. The block has no expandable calendar — only the bar and the legend.
The rate comes from the employee’s work mode in their user card.
- Flexible — no rate at all.
- Remote — the rate is 0%.
- Hybrid — a set percentage from 1 to 99.
- Office — 100%.
The calculation has two steps.
| Step | What is calculated |
|---|---|
| 1. How many office days were required | working days of the period minus the days with the “didn’t work” status, multiplied by the rate in per cent, rounded up |
| 2. Shortfall of days | the result of step one minus the actual office days; if the result is negative, there is no shortfall |
The shortfall is shown as a separate segment, insufficient office days, placed first on the bar. The other four segments repeat the schedule ones, with one wording difference: the absence status is labelled not working here and didn’t work in Employee Work Schedule — the same days under two names.
⚠️ This segment is not added to the bar — it is subtracted from the others. The shortfall first takes days from the “not filled” segment and, if those are not enough, from “remote”. So when there is a shortfall, the “not filled” number in this block is smaller than in Employee Work Schedule, while “remote” goes down only if the not-filled days were not enough. When the employee meets the rate, the numbers in both blocks are identical. This is not a data discrepancy but a different way of presenting the same days: the attendance rate block shows what the missing office days were spent on instead.
In the Flexible and Remote modes the shortfall segment is always empty, and the block looks like an ordinary status breakdown: in the first no rate is set, in the second it equals zero.
Example. The period has 20 working days, on two of them the employee is marked as “didn’t work”, and the work mode is Hybrid with a rate of 60%. Step one: (20 − 2) × 60% = 10.8, rounded up — the employee was expected in the office on 11 days. Step two: they were actually there on 7 days, so the shortfall is 11 − 7 = 4 days.
Those four days are then subtracted from the other segments. Say Employee Work Schedule splits the same period like this: 7 days in office, 8 remote, 2 “didn’t work”, 3 not filled. The bar of the attendance rate block looks different: 4 days of shortfall, 7 in office, 7 remote, 2 “not working” and nothing left as not filled — the shortfall took the three not-filled days and one remote day on top. It is still 20 days, but “remote” has become 7 instead of 8 and “not filled” 0 instead of 3. That is exactly the difference that makes the two blocks show different numbers for one period.
What is left out of the calculation
- Weekends and holidays are excluded everywhere. Days marked as non-working in the production calendar take part in none of the four blocks — neither in the numerator nor in the denominator.
- The denominator of every percentage is the working days of the period by the company production calendar, not the calendar length of the period.
- Percentages are adjusted to add up to exactly 100%. Because of that, the sum of the displayed shares may differ slightly from a straight rounding by days.
Why the numbers differ between blocks
| What you noticed | Why it happens |
|---|---|
| “remote” is smaller in the attendance rate block than in the schedule block | the office day shortfall is subtracted from “not filled” and then from “remote” |
| Fewer office days than bookings over the same period | the block looks at the schedule, not at the booking log; several bookings on one day still make one day |
| Custom company statuses are visible in one block and not in the next | Schedule completion tracking deliberately collapses them to the four base statuses |
| Part of the period looks suspiciously smooth | future dates were completed from the schedule template |
| The working days counter in the header does not match the block tooltip | the period spans two calendar years: the interface loads the production calendar only for the year the period starts in |