
By desks analytics: how the report is built
The report on the By desks tab answers a single question: how much money the company pays for workplaces nobody uses. It spreads the cost of owning the offices across departments and shows which part of it falls on days when the desks stood empty. This article takes the report apart: which blocks it consists of, how the “used / not used” bar reads, and by what rule the costs are distributed through the org structure.
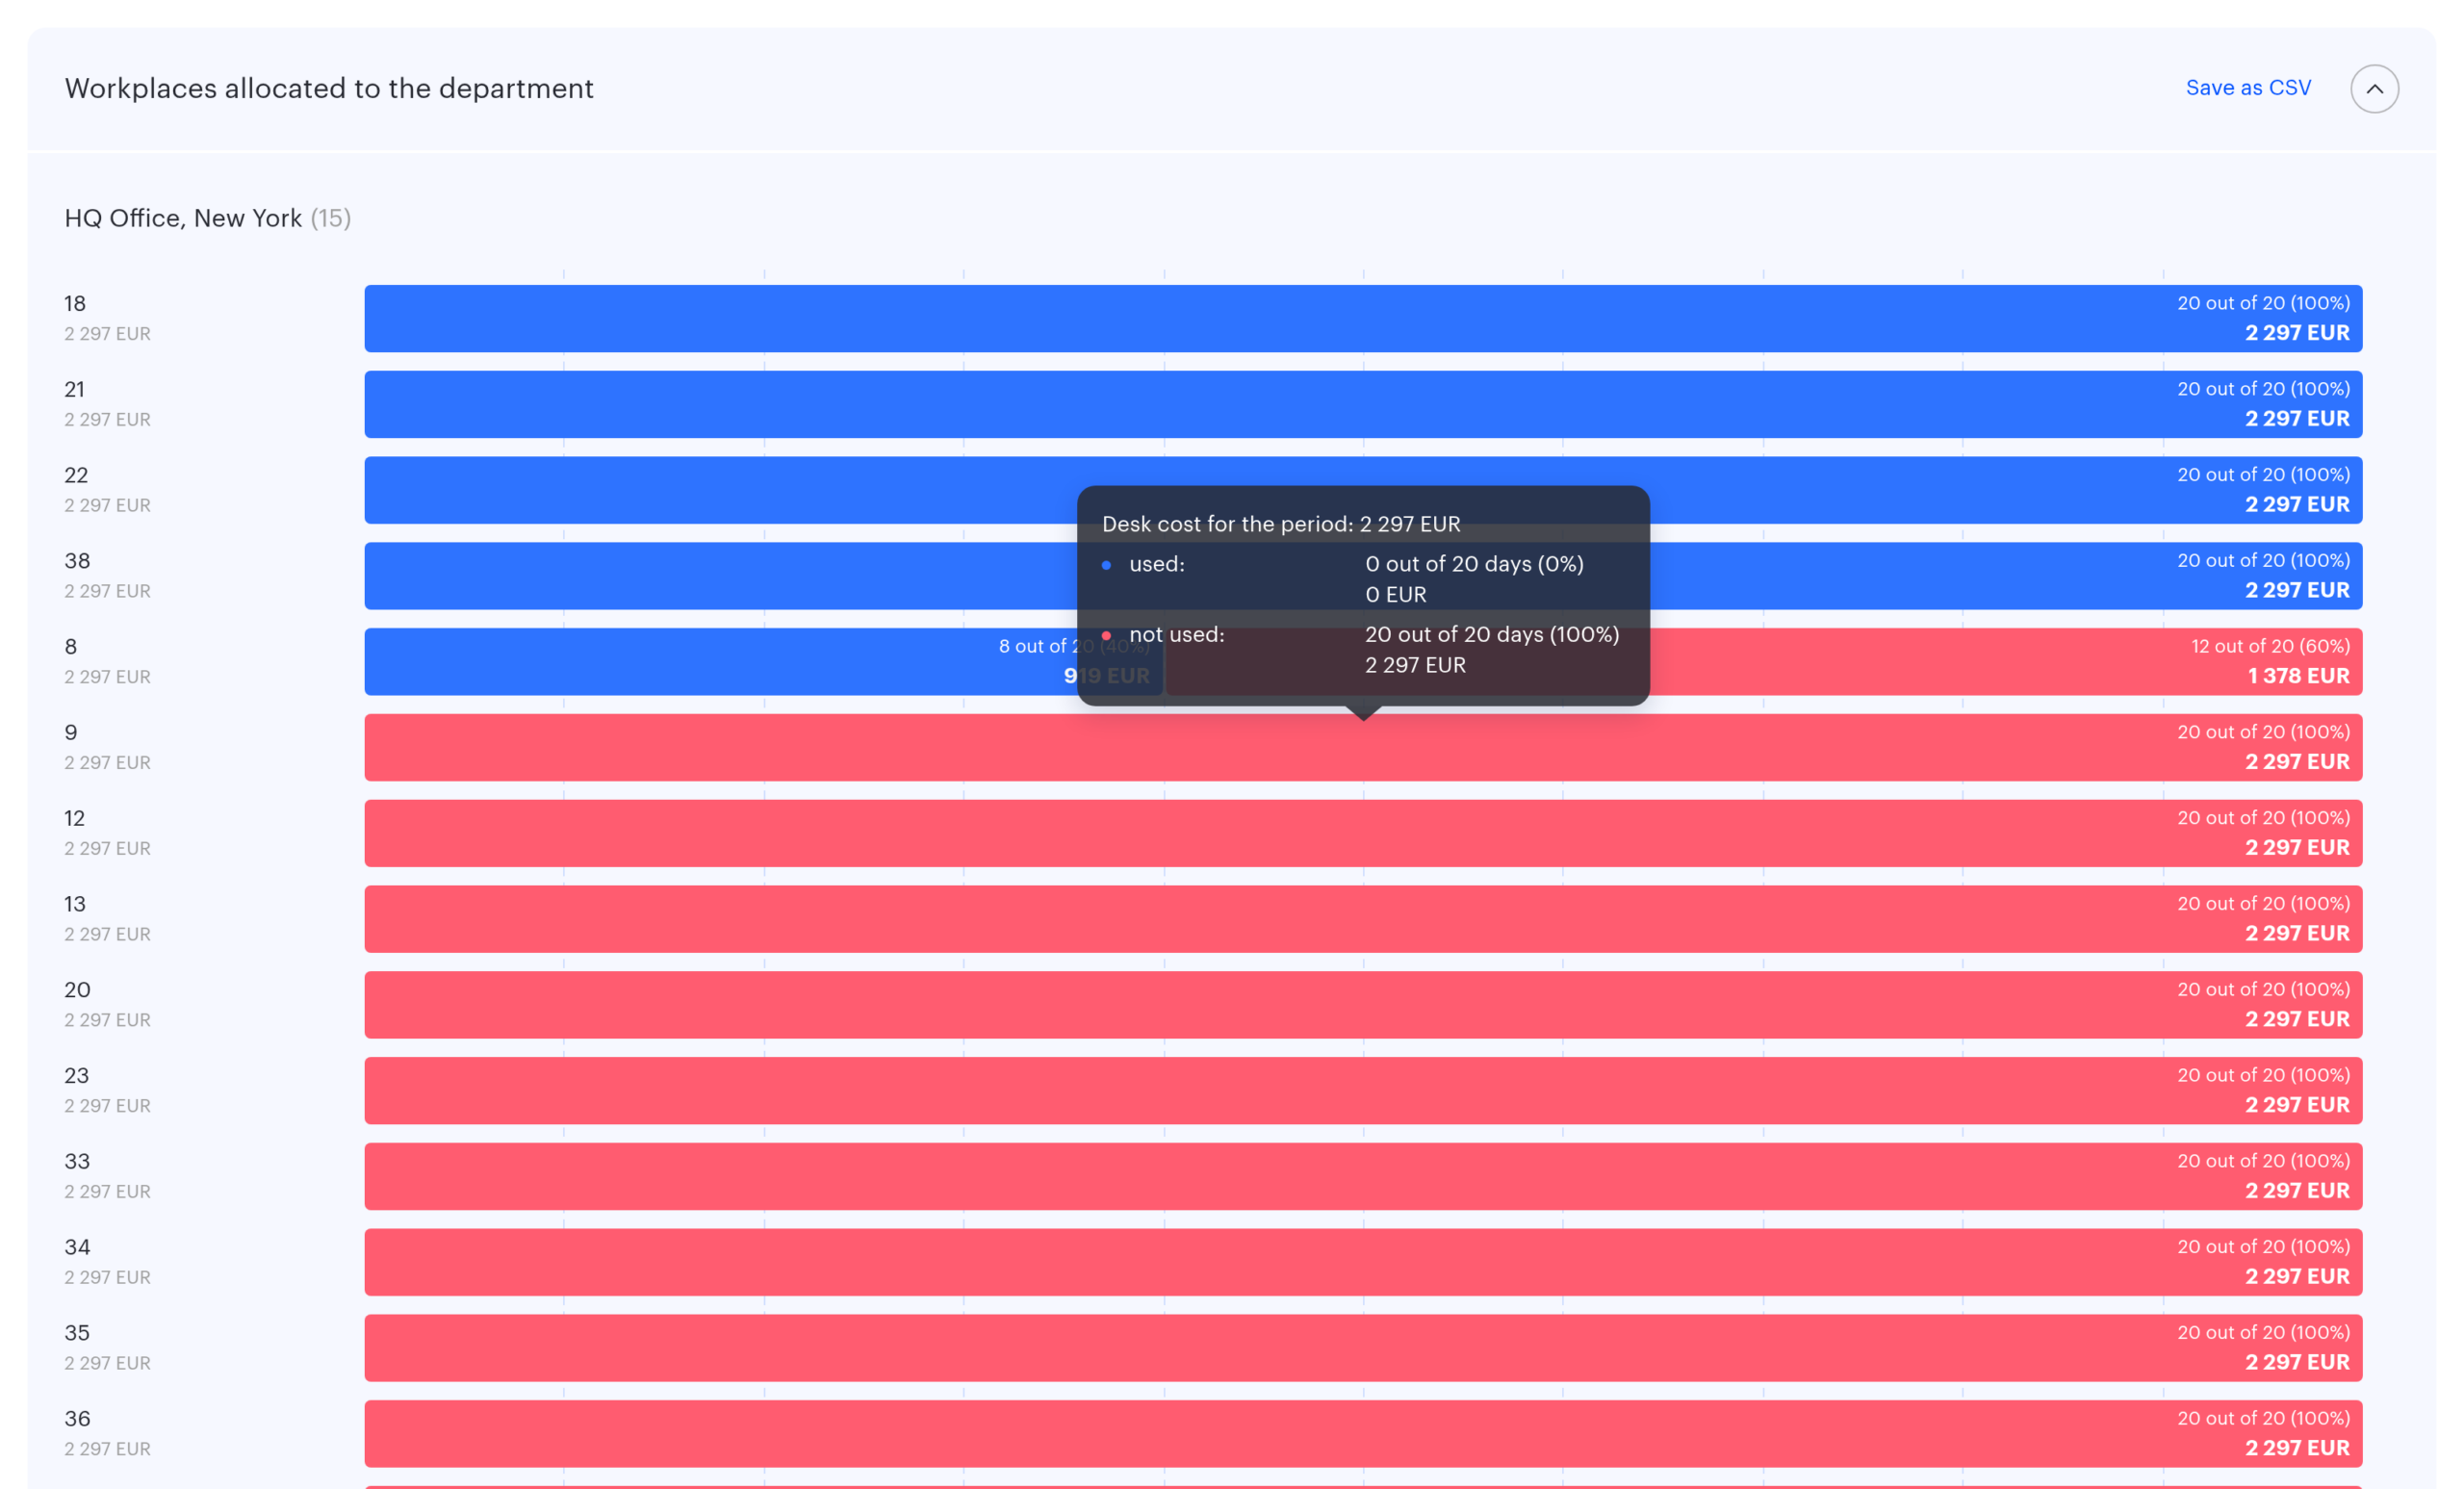
The three blocks of the report
Once a chart type is picked and the analytics is built, the page consists of three blocks. The two detailed ones are arranged the same way: a heading, an expand arrow, and inside them rows with a usage bar and a cost. The Total block has neither an arrow nor expandable content — it is a single summary bar.
| Block | What the rows contain | When it is shown |
|---|---|---|
| Total | a single summary bar for the whole selection and the number of workplaces | only when both blocks below are non-empty |
| Workplaces allocated to the department | one row per desk, grouped by office | when the selected department has desks of its own |
| Workplaces allocated to subordinate departments | one row per first-level child department | when the selected department has children |
⚠️ The bodies of the detailed blocks are collapsed on first load: the heading, the summary bar of the block and the legend are visible, while the rows of desks and departments are hidden. They are expanded with the round arrow at the right edge of the heading.
⚠️ Block headings are substituted when only one block is left. If the second block is empty, the remaining one is titled with the name of the selected department or with the company name instead of “Workplaces allocated to…”. It is not a different report, it is the same block under a different heading.
Inside the “allocated to the department” block the rows are grouped by office: the group heading is the office name with its parent and the desk count in brackets, and under it are the rows of individual desks. ⚠️ The number in brackets is the number of desks of the selected department in that office, not the total number of desks in the office; the divisor in the daily price formula is a different one — all desks of the office. In the subordinate departments block each department name is clickable and opens its card in a side panel.
The “used / not used” bar
The bar of every row is split into two segments: blue is used, red is not used. The width of a segment is the share of the corresponding days, and the label inside shows both days and money.
- The segment label carries an “X out of Y” ratio with a percentage plus the amount in the company currency.
- The hover tooltip starts with the line Desk cost for the period: N, followed by one line per segment with days, percentage and amount.
- Labels appear inside a segment only when the segment is wider than 15%. For narrow segments the figures are visible in the tooltip only — a frequent source of the question “why does one row show numbers and another does not”.
- If a row has no desks at all, the bar is a solid grey strip across the full width and has no tooltip.
⚠️ If the row does have desks but the period contains no working day at all, the bar looks like “100% not used”, not like “no data”. A row with no desks whatsoever looks different — a solid grey strip.
In the subordinate departments block the rows are sorted by descending usage share: the busiest are at the top, the idle ones at the bottom; on an equal share the cost, the number of desks and the name are compared. In the desks block the sorting works inside each office group, not across the whole block.
What counts as usage
This is the key mechanic of the report, and it is simpler than it looks.
| Value | How it is calculated |
|---|---|
| Working days of the period | days of the period minus non-working days from the production calendar and the company week template |
| Used | the number of distinct working dates on which the desk had at least one booking; bookings on weekends and public holidays of the company calendar are not taken into account |
| Not used | working days of the period minus the days of usage |
| Cost of a desk day | the monthly office ownership cost divided by the number of desks in the office and by 22 |
| Cost of a segment | the cost of a day multiplied by the number of days in the segment |
Days are counted, not hours and not the number of bookings. Two bookings of the same desk on the same date give one day of usage. A four-hour booking and a full-day booking count the same.
Not counted: cancelled bookings and bookings released automatically because they were not confirmed by check-in. So if an employee booked a desk and did not show up, with booking confirmation enabled that day lands in “not used” — which is correct for a financial report.
⚠️ A booking released after it has started is counted by the report as a fully used day. The employee came in, worked for an hour and freed the desk — the day is still counted: such a booking is not deleted, it is finished early. Only bookings released before they started and bookings cancelled automatically for a missing confirmation are left out.
Booking dates are resolved in the office time zone when the office has the default settings switched off and its own time zone and working hours defined; otherwise the company time zone is used.
Where the ownership cost itself comes from and why the formula uses 22 is explained in the overview article for the tab.
How costs travel through the org structure
The report always looks at the org structure from a single point — from the selected department downwards. If no department is selected, the starting point is the company as a whole.
- The allocated to the department block collects desks linked strictly to the selected department, not to its descendants.
- The allocated to subordinate departments block gets one row per direct child of the selected node.
- Desks that sit deeper are not lost: their costs are added to the row of the first-level child in whose subtree the desk lives. The row “Development department” includes both the desks of that department and the desks of all its teams.
That makes the report convenient to read top-down: pick the company and you see the split across large departments; pick a department and you see the split across its units plus its own desks. The Total block meanwhile sums up the entire selection, including desks that fell into neither detailed block.
Desks with no department
When desks are not linked to any department, the report behaves in a special way, and it is worth knowing in advance.
- When no department is selected, the Workplaces allocated to the department block shows exactly the desks with no department, not all desks of the company. This is the most common misreading of the report.
- An alert appears above the blocks: In the organisation of N workplaces that do not belong to any department — it is shown only when there is no department filter, including with a zero when there are no such desks.
- When a department is selected, desks with no department drop out of the report entirely — they are in neither detailed block and not in the Total block either. The only way to see them is the All mode.
If the alert reports a noticeable number, the department breakdown is incomplete. Linking desks to departments is configured in the desk card — see Access through the org structure.
Which desks enter the report
- Excluded: archived desks, desks of archived and disabled offices, and desks created after the end of the selected period.
- Included in full: desks created inside the period. ⚠️ Such a desk is treated as if it had existed for the whole period, so its “not used” figure is overstated. For new offices this distorts the picture noticeably — build the report over a period that starts after the desks went live.
- Only workplaces are taken into account. Parking spaces, meeting rooms and lockers do not participate in this report.
What to do with these figures
The report does not make decisions for you — it shows where to look for money.
| What you see | What it means | What to do |
|---|---|---|
| A department has a high “not used” share with a large number of desks | more desks are allocated than the current way of working needs | revisit the desks allocated to the department or move part of them into the shared pool |
| The idle share is high across every department at once | the cause is not the departments but the mode of work: the office is sized for full attendance while the schedule is hybrid | cross-check with the office capacity potential block on the By office tab |
| A large amount in the row with no department | the desks are not linked to the org structure, so the costs cannot be distributed | link the desks to departments — until then the breakdown by department is incomplete |
| Usage percentages are high while the amounts are zero | the ownership cost is not filled in for the offices | check the Monthly office ownership cost field for every office in the selection |
| One desk stands idle while its neighbours are busy | the desk is inconvenient rather than redundant | look at its position on the floor plan on the On the map tab |
How a row reads. Take the desk from the example in the overview article: a daily price of 1,000, a period of 20 working days, bookings on 8 different days. The blue segment shows “8 out of 20 (40%)” and €8,000, the red one “12 out of 20 (60%)” and €12,000, and the tooltip starts with the line “Desk cost for the period: 20,000”. If a department has ten such desks, its row in the subordinate departments block gives €120,000 in the red segment — and that is the figure the report is opened for.
Why a block did not appear
| What you see | Cause |
|---|---|
| No summary block (its heading is the department or company name, the row inside is Total) | one of the two detailed blocks is empty — the summary bar is shown only when both exist |
| “Nothing found” instead of the blocks | the selected department has neither its own desks nor child departments |
| The message “Analytics chart not built” | no chart type selected in the parameters |
| The block heading is the company name | the second block is empty, so the heading was substituted |
| All amounts are zero while percentages exist | the ownership cost of the offices is not filled in |
| The sum of the two blocks does not match Total | the amounts are rounded to whole units in every row independently |