
By desks analytics: overview
The By desks tab turns office workload into money: it shows which part of the cost of owning workplaces falls on days when the desks stood empty, and how those costs are spread across the org structure. The report is built around departments, so it is the right tool for the question “which department pays the most for unused desks”. This article is the entry point: it explains who can open the tab, where the cost comes from and which of the detailed articles to read next.
What you need
Open Analytics → By desks. The tab is available to the Super Administrator, the Office manager and the Integrations Administrator. The Offices Administrator and Users Administrator roles do not see the tab in the tab bar, but the page opens for them by a direct link. A regular employee does not see it, even if they head a department — unlike the By office tab.
For the report to show money and not only percentages, two settings are required: the company currency and the monthly office ownership cost. Without them the report is still built, but every amount is zero.
Setup order
- Set the company currency — Company settings, the Currency field.
- Fill in the ownership cost for every office — the office card, the Additional information block; exactly where is explained below.
- Link workplaces to departments — otherwise the costs cannot be broken down by org structure, see Access through the org structure.
- Build the report — you must pick a chart type, see Filters, period and export.
Where the cost comes from
One detail changes how the whole report reads: the cost is set per office per month, not per individual desk. There is no “desk price” field in the product — the price of a desk is derived by division.
| Parameter | Where it is set | Constraints |
|---|---|---|
| Currency | Manage → Company settings, the Currency field | one per company, a free-form string; the report does not convert between currencies |
| Monthly office ownership cost | the office card → the Additional information block → Edit information | an integer from 0 to 999,999,999 |
In the office card the field is shown together with the currency label. It is labelled Monthly office ownership cost in edit mode and Monthly ownership cost in view mode. When it is empty, the view mode shows not specified. If the currency has not been set yet, the edit dialog shows a hint linking to the company settings.
What to include in that amount is up to the company: rent, utilities, maintenance, depreciation of furniture and equipment. The report never validates the composition of the sum, it only distributes it.
How the cost of a desk day is calculated
The cost of one day of one desk is obtained by two divisions:
- the monthly ownership cost of the office is divided by the number of desks in that office;
- the result is divided by 22 — a fixed nominal number of working days in a month.
This daily price is then multiplied by the number of days the desk was used and by the number of days it stood idle.
Example. The monthly ownership cost of the office is €660,000 and the office has 30 workplaces. The daily price of a desk: 660,000 ÷ 30 = 22,000 per desk per month, 22,000 ÷ 22 = 1,000 per desk per day. The report is built for a period of 20 working days. A desk that was booked on 8 different days enters the report like this: used — 8 days and €8,000; not used — 12 days and €12,000; a usage share of 40%.
The full cost of that desk for the period is €20,000 and not €22,000: the daily price is always divided by the fixed 22 days, while it is multiplied by the real number of working days in the period. In a month with 18 working days the same desk costs €18,000 in the report.
⚠️ The number 22 is fixed and does not depend on the production calendar. The working days of the period itself, however, are counted from the company calendar, with holidays and moved days. Because of that the “per period” amount does not match the naive arithmetic of “ownership cost × number of months”; in months with many public holidays the gap is the most visible. The report works well as a way to compare departments with each other and poorly as an exact accounting statement.
⚠️ The divisor is every desk in the office, not only the desks of the selected department. This also holds with a department filter applied: otherwise a narrow filter would inflate the daily desk price several times over.
Which question goes where
| Question | Where to look | Details |
|---|---|---|
| Which desks stand idle and what it costs | the Workplaces allocated to the department block | How the report is built |
| Which department pays the most for idle desks | the Workplaces allocated to subordinate departments block | How the report is built |
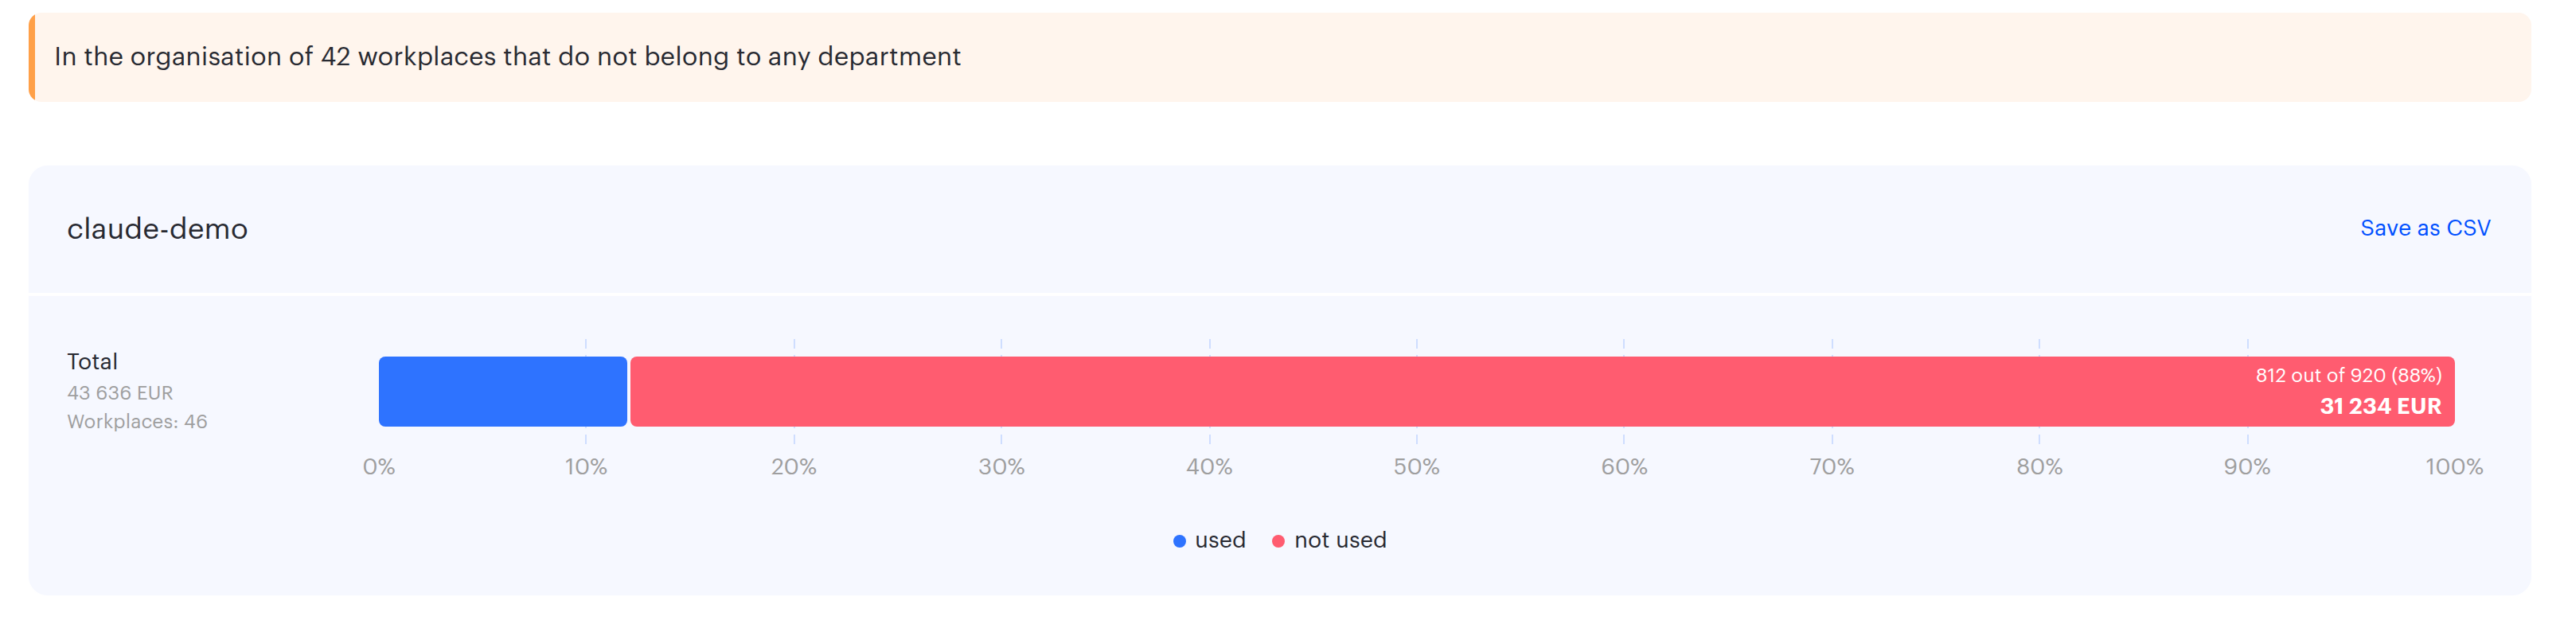
| How many desks belong to no department at all | the alert above the blocks | How the report is built |
| How to set the period and the scope | the Build analytics dialog | Filters, period and export |
| How the PACS mode differs from Bookings | the By data chip in the parameters | Filters, period and export |
| How to export the figures to a file | the Download CSV button on the blocks | Filters, period and export |
| Workload in counts and hours instead of money | another tab | By office |
| Where exactly in the office the desks stand idle | another tab | On the map |
Limitations and common misreadings
- The report covers workplaces only. Parking spaces, meeting rooms and lockers are out of scope, even though they cost money too.
- “Used” means days, not hours. A one-hour booking and a full-day booking count the same; two bookings on the same date give one day.
- The period cannot be longer than three months.
- Cancelled bookings and bookings not confirmed by check-in do not count as usage — which is the correct behaviour for a financial report. ⚠️ But a booking released after it has started — the employee came in and then freed the desk — is counted by the report as a fully used day.
- Desks created inside the period are treated as if they had existed for the whole period, so their idle time is overstated.
- If no department is selected, the first block shows desks with no department, not every desk in the company.
- An empty ownership cost is treated as zero — the rows and percentages remain, the money is zero.
Troubleshooting
| Symptom | Cause |
|---|---|
| “Analytics chart not built” | no chart type selected in the parameters |
| “Nothing found” | the selected department has neither its own desks nor subordinate departments |
| All amounts are zero | the ownership cost of the offices is not filled in |
| Amounts without a currency label | the company currency is not set |
| Almost every desk sits in one “no department” group | desks are not linked to the org structure |
| The Total block is missing | one of the detailed blocks is empty |
| Every row shows the same percentage | the By data: PACS mode is on, where the share is common to all desks |
| The quarterly amount is not equal to the cost × 3 | the daily price uses the fixed 22 days |