
By employee analytics: overview
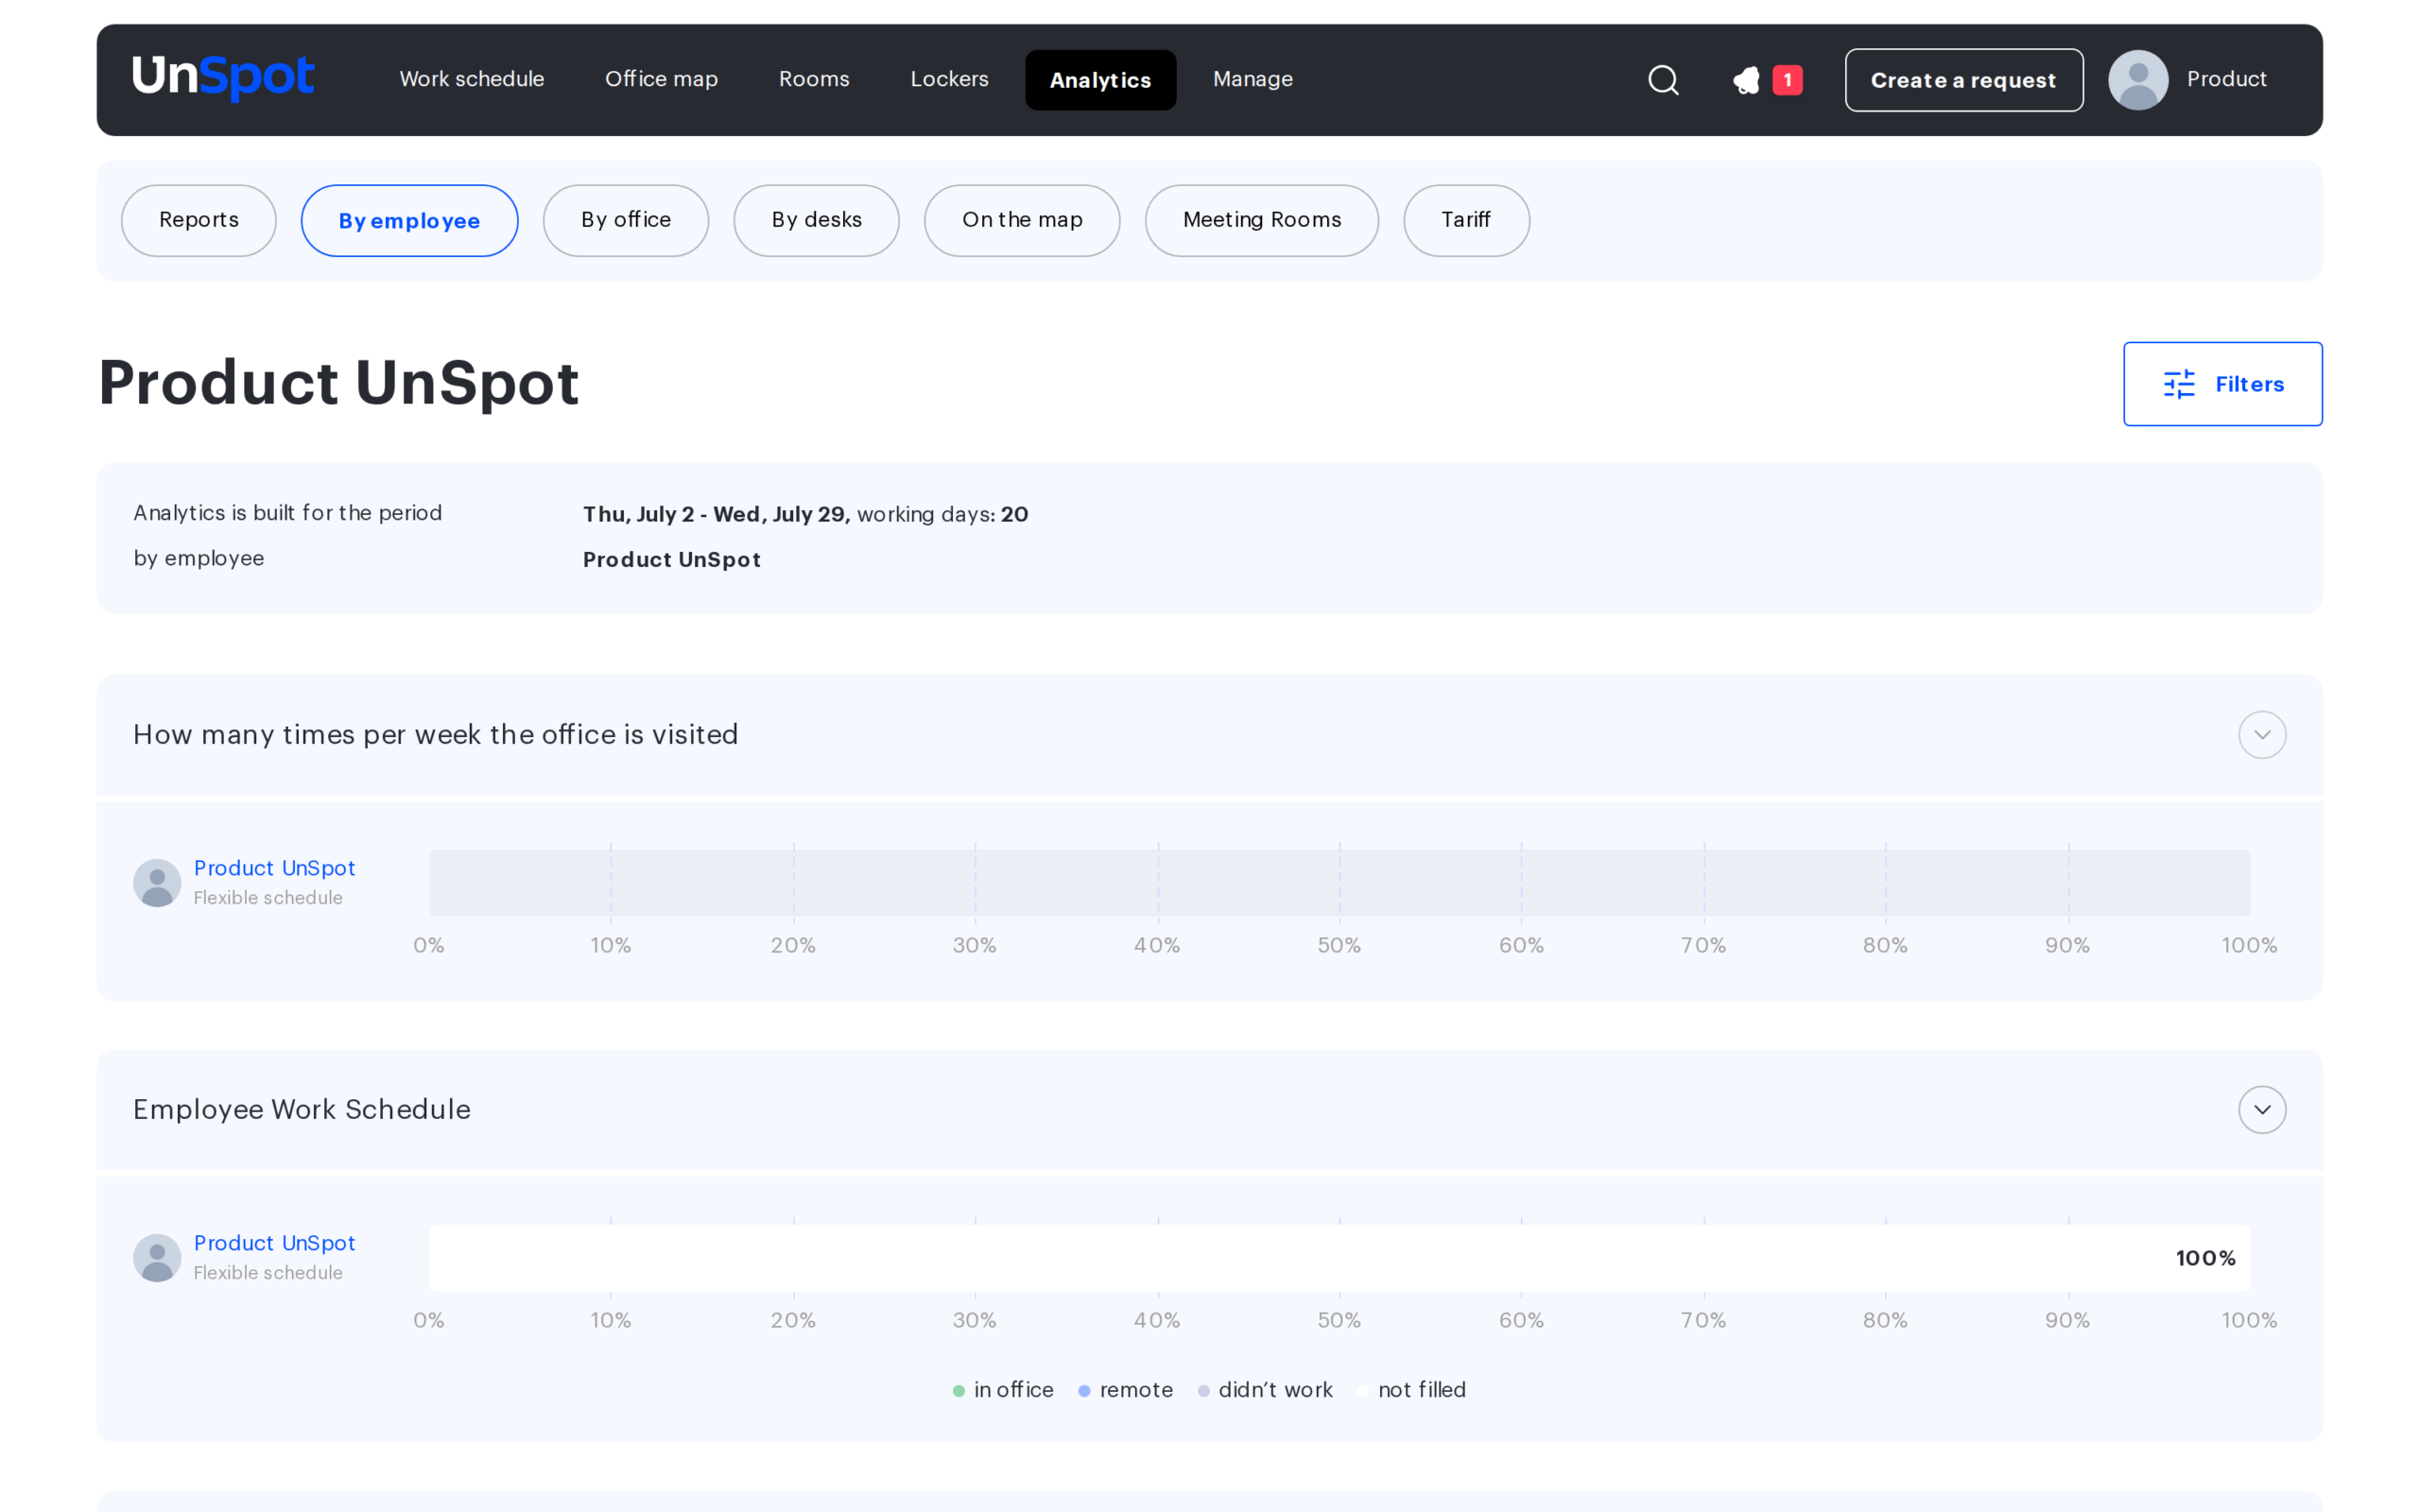
The By employee tab is the only place in the Analytics section where the picture is built around a single person rather than around an office or a resource type. It answers the questions “how often does this person come to the office”, “do they keep the schedule up to date”, “is the office attendance rate being met” and “do the bookings match the actual visits”. This article is the entry point: it shows how the page is organised, how your own profile differs from someone else’s, and which detailed article covers which block.
What you need
Open Analytics → By employee. The tab is available both in the side menu and in the tab bar of the section.
The tab is available to every employee — the same is true of Reports. The other tabs of the section need either a role or subordinates — see the table.
| Tab | Who can open it |
|---|---|
| By employee | every employee; the data is limited to the circle of your subordinates |
| Reports | every employee |
| By employees | the Super Administrator, Office manager and Integrations Administrator roles; the Offices Administrator and Users Administrator do not see the tab in the tab bar, but the page opens for them by a direct link |
| By office | anyone who has subordinates: the right to manage all users, the Subordinates list, teams or managing a department; the role does not matter |
| By desks | the Super Administrator, Office manager and Integrations Administrator roles |
| On the map, Meeting Rooms | the Super Administrator, Office manager, Offices Administrator and Integrations Administrator roles |
| Tariff | the Super Administrator, Office manager, Offices Administrator and Users Administrator roles |
How much of that you actually see is limited to the circle of your subordinates: with no subordinates only your own profile is available, and the employee selector stays disabled.
When you open the tab for the first time, the analytics is already built for you personally over the last four weeks up to and including yesterday. The current day is not part of the default period.
Which question goes where
| Question | Block on the page | Details |
|---|---|---|
| How many days a week the person is in the office | How many times per week the office is visited | Office attendance and work schedule |
| How office, remote and non-working days are distributed | Employee Work Schedule | Office attendance and work schedule |
| Whether the employee fills in the schedule diligently | Schedule completion tracking | Office attendance and work schedule |
| Whether the employee meets the office attendance rate | Attendance Rate Control | Office attendance and work schedule |
| Whether the person keeps bookings or cancels them | How often bookings are cancelled | Cancelled bookings and attendance check |
| Whether bookings match actual office visits | Office attendance does not match bookings | Cancelled bookings and attendance check |
| How to pick another employee and another period | The Build analytics window | Filters, period and employee selection |
| The picture for a department or a whole office | another tab | By employees, By office, By desks |
Your own profile and someone else’s
The set of blocks on the page depends on whose profile is open. Your own profile shows three blocks, someone else’s shows six. The three “control” blocks are meant for a manager looking at the team, so they are not rendered in your own profile.
| Block | Own profile | Someone else’s profile |
|---|---|---|
| How many times per week the office is visited | yes | yes |
| Employee Work Schedule | yes | yes |
| Schedule completion tracking | no | yes |
| Attendance Rate Control | no | yes |
| How often bookings are cancelled | yes | yes |
| Office attendance does not match bookings | no | yes |
The employee list contains you and your subordinates. That circle is assembled from five sources, and they combine with an “or”.
- You are marked as the head of a department in the org structure.
- The employee is listed in the Subordinates field of your user card.
- You are listed in the Manager field of the employee’s card.
- The employee belongs to a group listed in the Teams field of your user card.
- You are allowed to manage all users — then the list contains the whole company.
For details, see the article about filters.
How the page is organised
- The page heading is the name of the selected employee, not the name of the tab.
- Below the name there is a line with the current parameters: the period, the employee and the working days counter.
- The Filters button on the right opens the Build analytics window.
- Further down are the block cards: a title, a full-width bar and a legend. Most cards have an arrow that expands a month-by-month calendar where every day is filled with the colour of its status.
There is no CSV export on this tab. If you need the data as a file, use the Reports section.
Three data sources
The six blocks of the tab are built on three different sources, and that is the main reason their numbers do not add up to each other. A discrepancy is not a data error — the blocks simply count different things.
| Source | Blocks based on it | What it knows |
|---|---|---|
| Employee schedule | the first four | the status of each day and whether a desk is assigned |
| Booking log | How often bookings are cancelled | what happened to each desk booking |
| Attendance log (PACS) | Office attendance does not match bookings — together with the schedule | on which days an entry to the office was registered |
Limits and common misconceptions
- The period cannot be longer than three months. If you exceed it, a warning appears and the request is not sent.
- Weekends and holidays are excluded everywhere. The denominator of the percentages is the working days of the period in the company work calendar, not the calendar length of the period. There is exactly one exception: in How often bookings are cancelled the denominator is the number of days on which there was at least one booking.
- The future part of the period is a forecast. For dates from next week onwards that have no explicit status yet, the status is completed from the schedule template.
- The By department chip in the parameters does not work — the department mode is not implemented on this tab.
- The current day is not included in the report by default.
- The working days counter in the header and the denominator of the percentages follow the same rule — the working days of the period in the company work calendar. They are calculated in different places, the counter in the browser and the percentages on the server, so they can diverge when the period spans two calendar years.
- The cancellation block counts desks only — meeting rooms, parking spaces and lockers are not included.
- Percentages are adjusted to add up to exactly 100%, so the sum of the shares may differ slightly from a straight rounding by days.
Troubleshooting
| Symptom | Where to look |
|---|---|
| The employee selector is greyed out | you have no subordinates — only your own profile is available, see filters |
| Fewer blocks than expected | your own profile is open — the three control blocks are not rendered there |
| Both “attended” segments of the attendance check block are empty | no PACS data is arriving, see cancellations and the attendance check |
| The “remote” numbers differ between two blocks | this is by design, see the breakdown of the attendance rate block |
| Fewer office days than bookings | the block counts by the schedule, not by the booking log |
| The card does not expand with the arrow | there is no data for this block in the period |
| The selected dates disappeared after clicking a chip | a grouping chip resets the period — pick the chip first, then the dates |
Related articles
- By employee analytics: filters, period and employee selection
- By employee analytics: office attendance and work schedule
- By employee analytics: cancelled bookings and attendance check
- By office analytics: overview
- By employees analytics: overview
- By employees analytics: the three charts and their calculation
- Reports
- Work schedule: section overview