Meeting rooms workload
In this page you can view by heatmap and by graph the number of meeting room bookings for the time interval of interest.
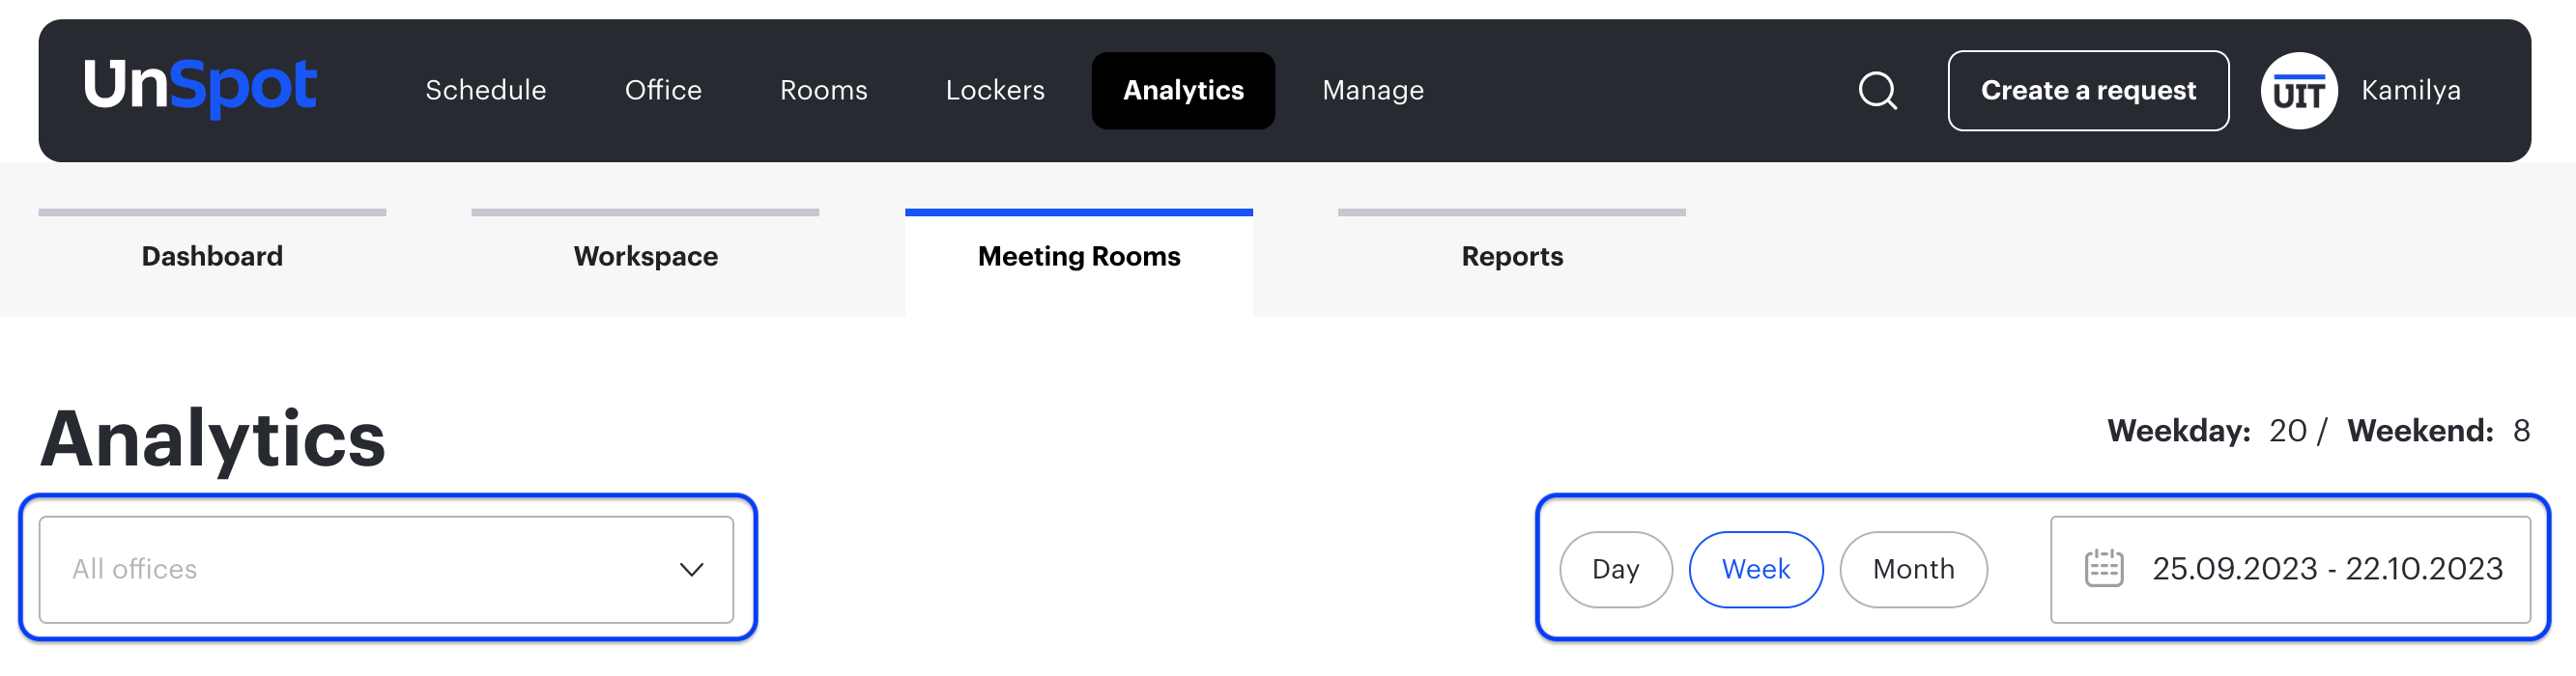
To view it, go to the Analytics > Meeting rooms
Select the required office and set the time interval
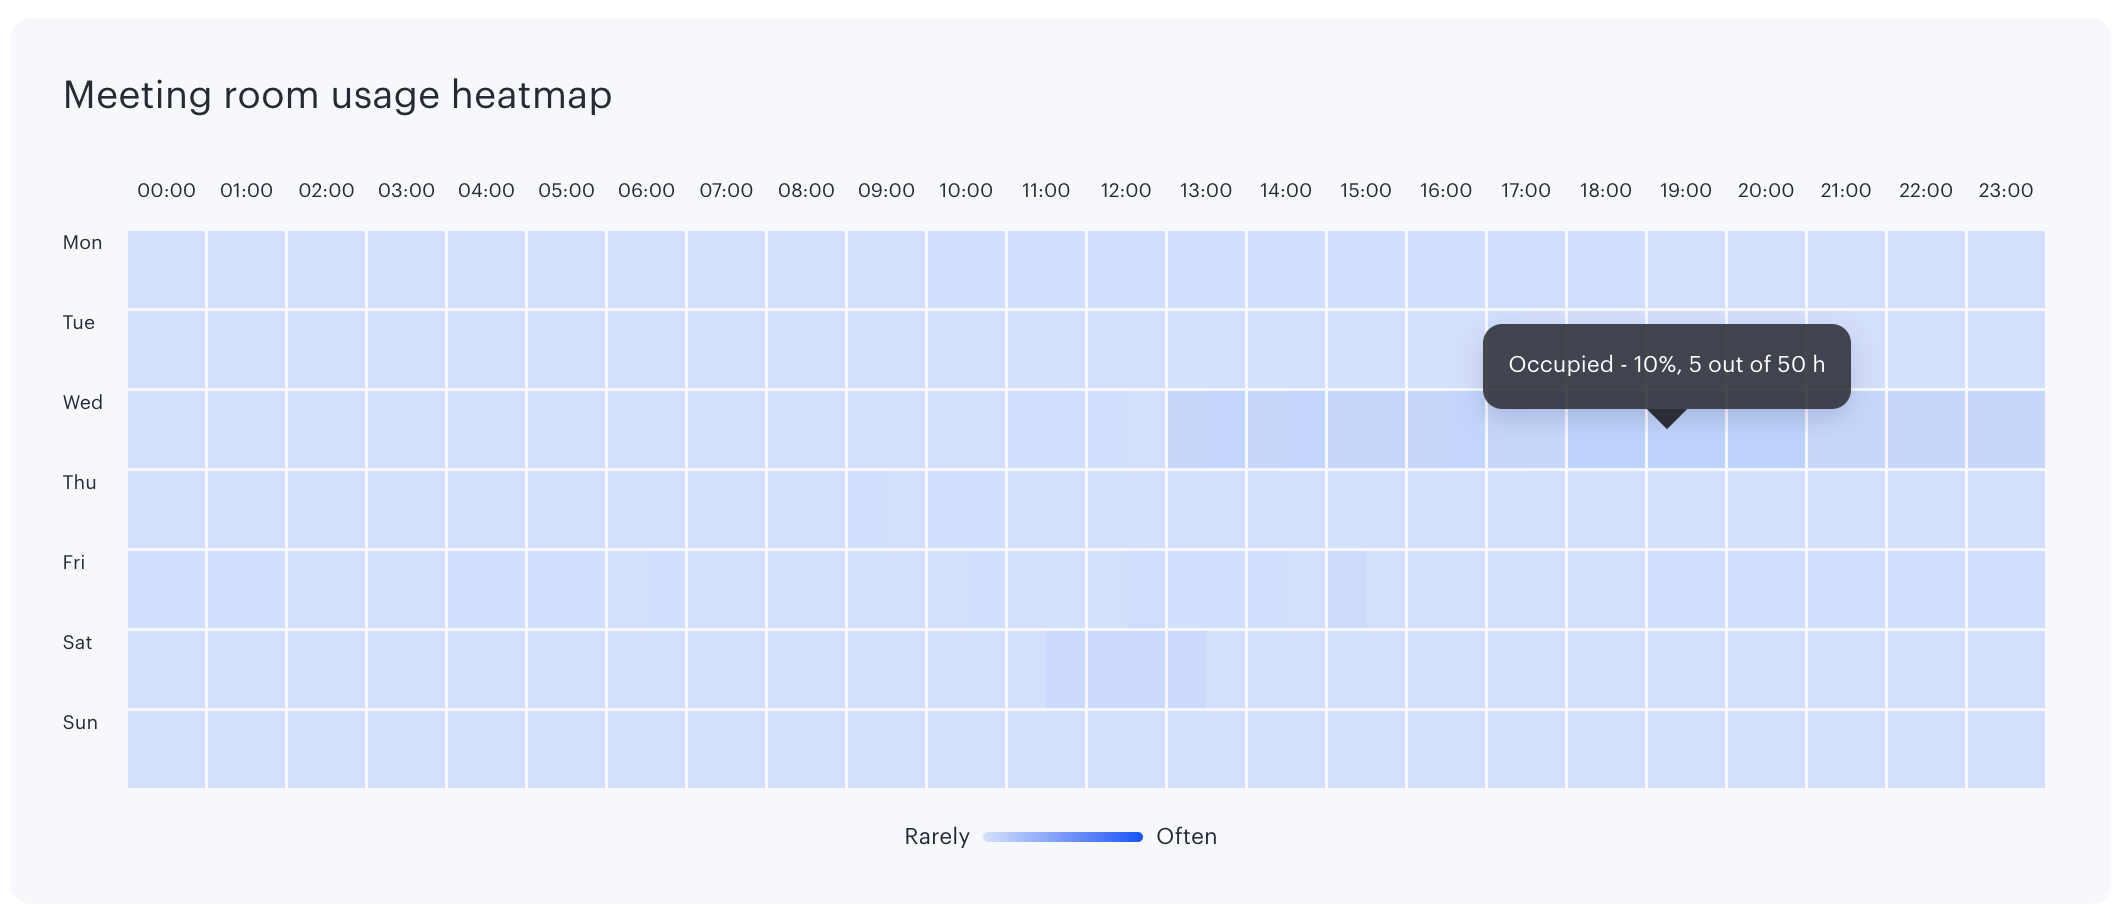
Heatmap
The heatmap visualizes the most popular times and days of meeting room bookings using color. The more times they have been booked in the selected period, the more saturated their color is. If you hover over a slot, you can see the number of occupied hours in that period.
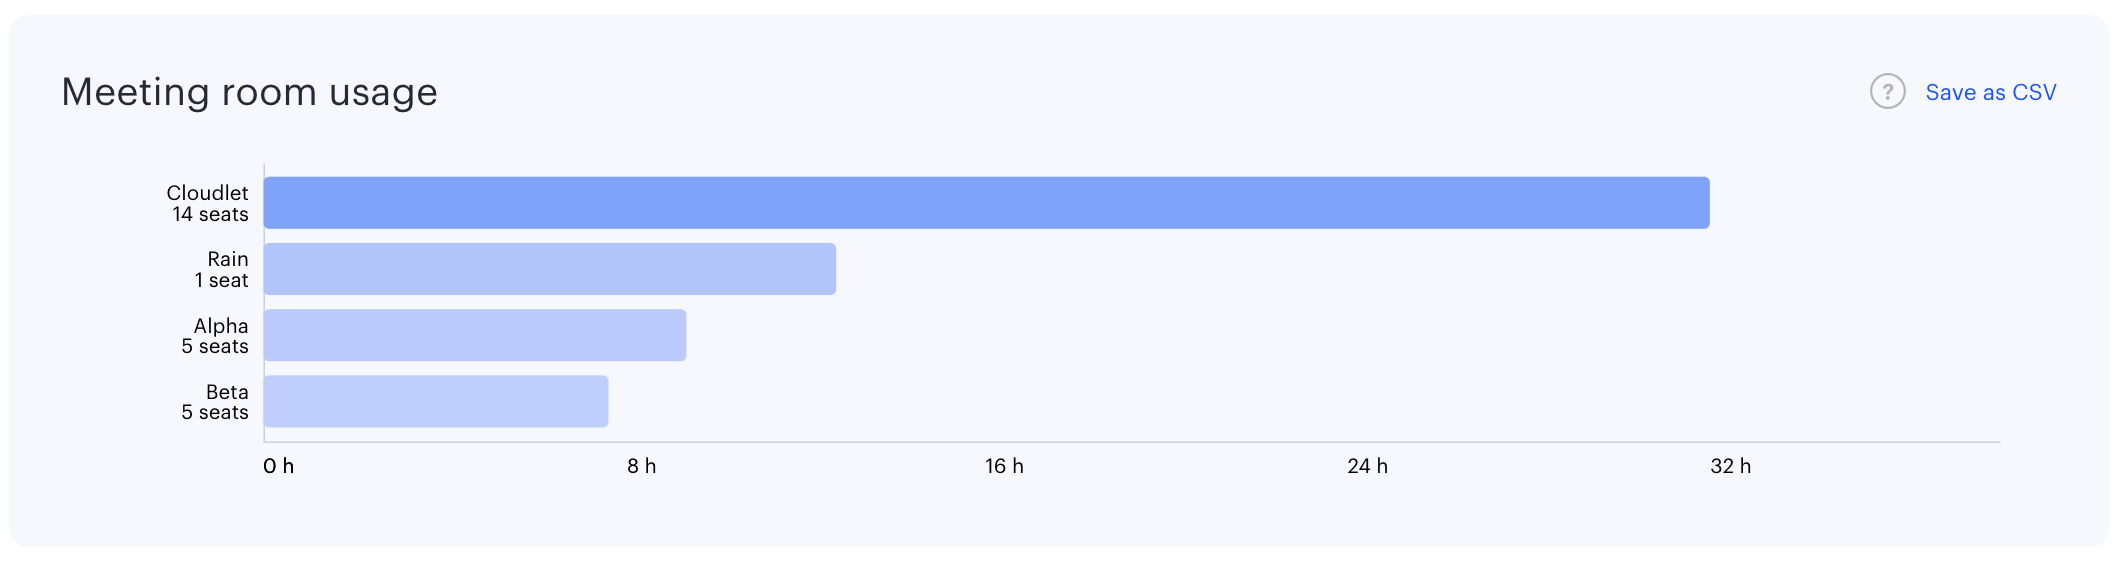
Graph of meeting room usage
The graph of meeting room usage shows the total booking time of meeting rooms for the selected period from the most popular one by booking to the least popular one.
This data can be downloaded in CSV report format.