
By office analytics: filters and period
Analytics on the By office tab is always built from a set of parameters: which period to count, which resources to include, whose activity to take into account and which data to use — bookings in UnSpot or actual entries recorded by a PACS. All of it is configured in one window and applies at once to every tile and every chart on the page. This article covers each filter: what it limits, which options it offers and how the result changes.
Where to set the parameters
Open Analytics → By office — the page is titled Office workload — and click Filters in the top right corner. The Build analytics window opens with four sections:
- For the period — the date range the analytics is calculated for.
- By resources — which places, rooms and cells to count.
- By employees — whose bookings and visits to count.
- By data — the source: bookings or PACS events.
Settings are applied with Save; Cancel closes the window without changing anything.
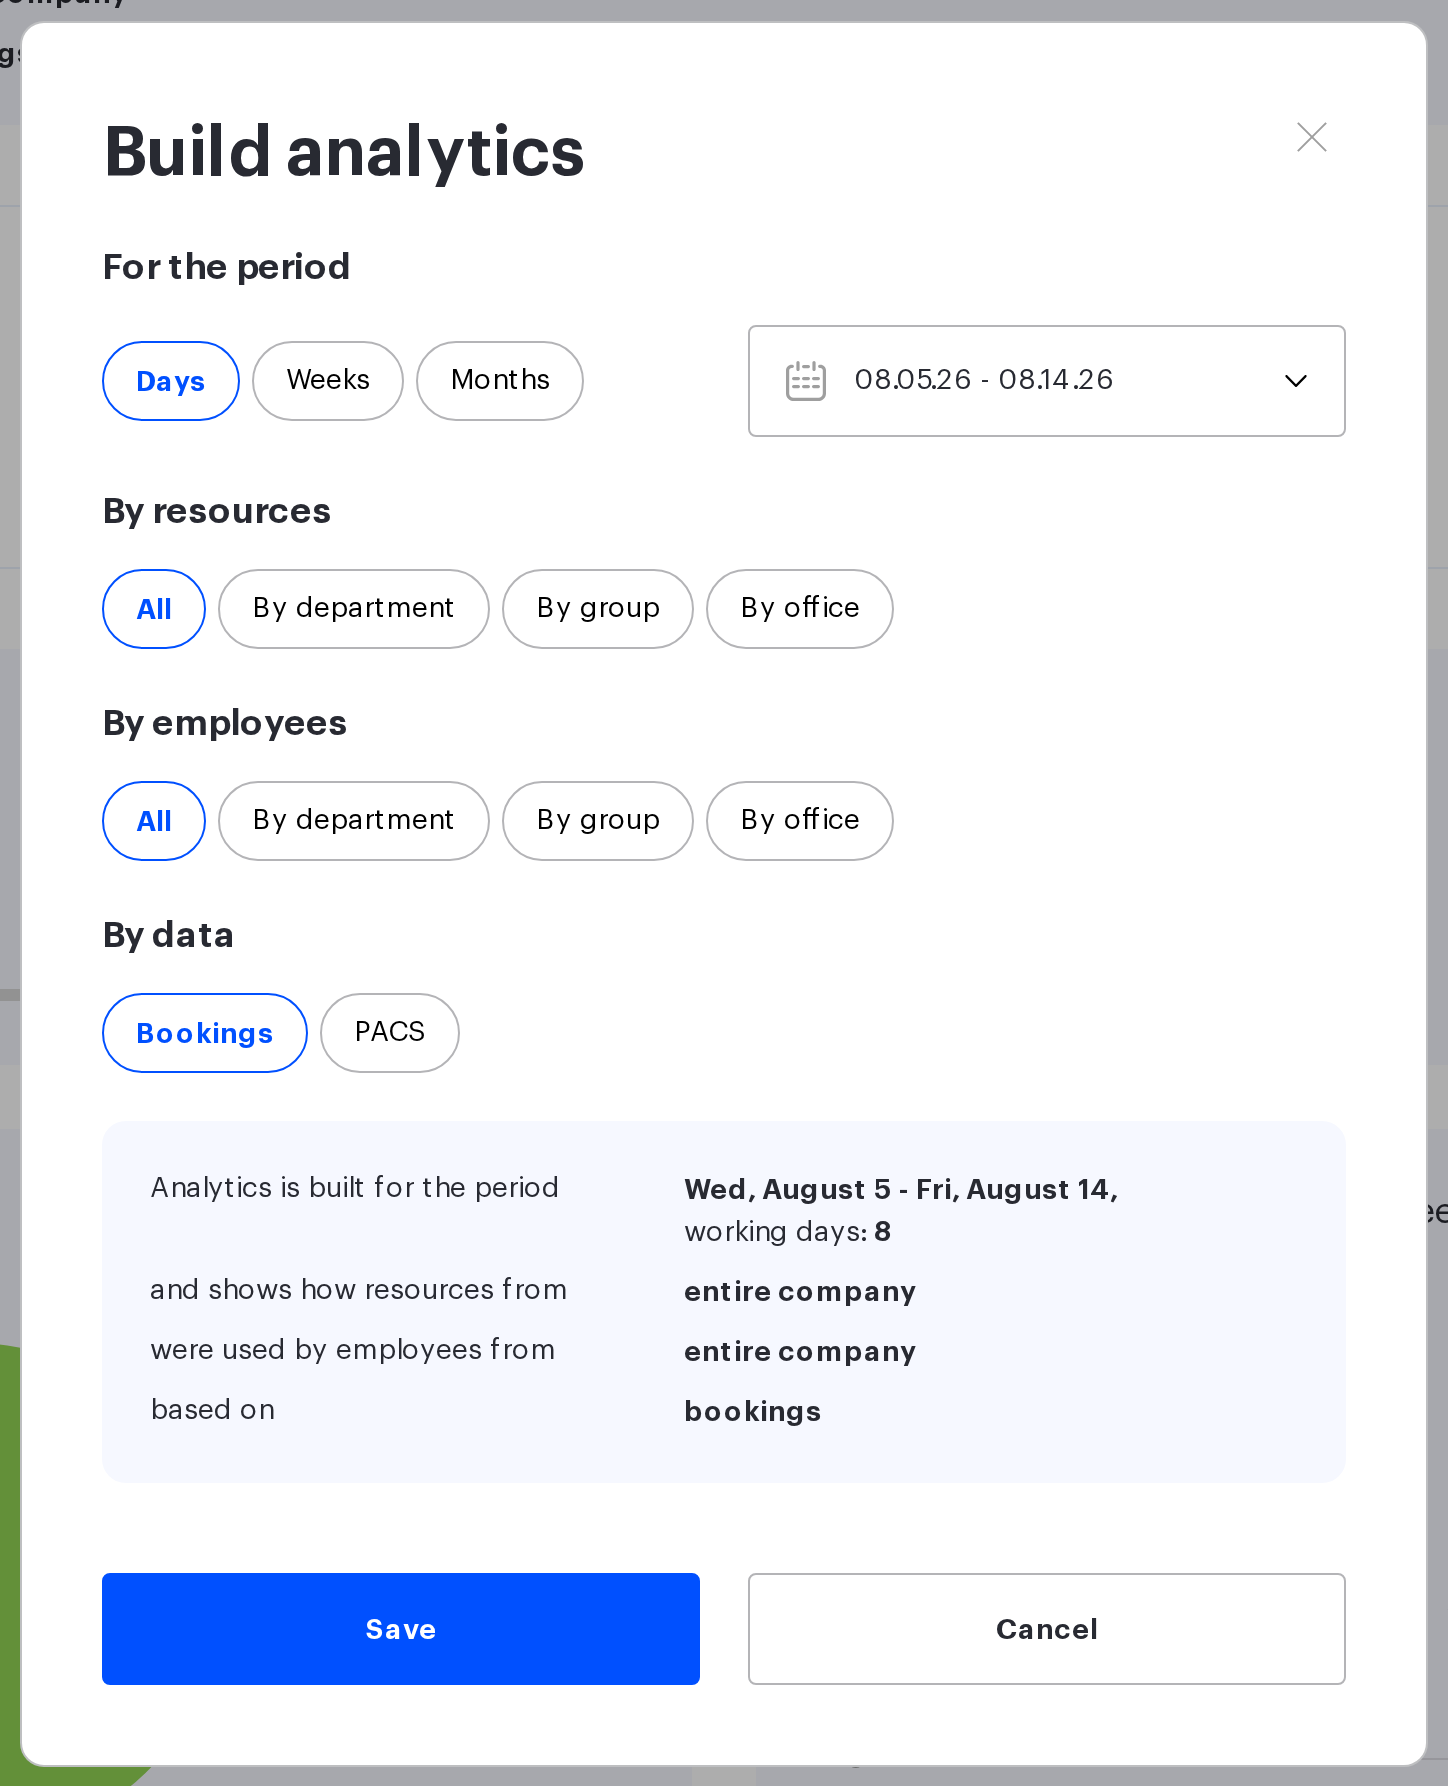
Access to the tab is defined by having subordinates, not by the role: it is visible to an employee with any role whose user card has Subordinates set to All users, or who has at least one subordinate — through the Subordinates list, the Manager field, a team, or as the manager of a department. An administrative role on its own does not grant access. Whether the employee has the All users option also defines which options are available in the filters — this is described below for every section. Analytics is already built when you open the page: the default period is the last four weeks up to and including yesterday, every other filter is set to its first option — All (for an employee without the All users option the By employees section calls it By subordinates), and the data source is Bookings.
While the calculation is running, the Filters and Upload PACS data buttons are inactive and grey placeholders are shown instead of the numbers on tiles and charts.
For the period
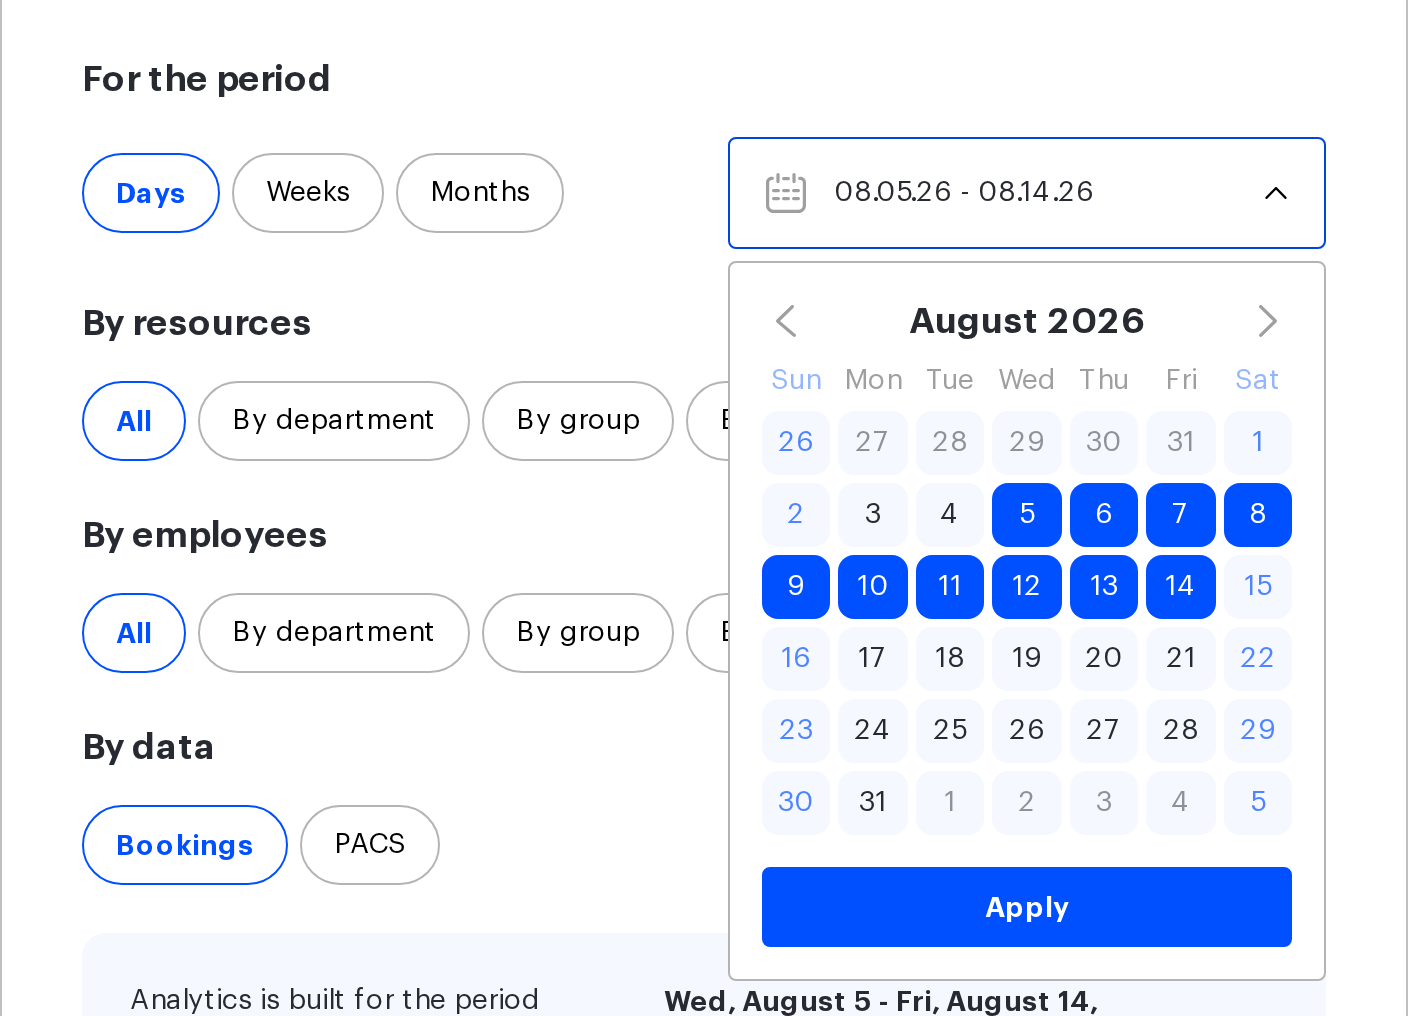
This section sets the date range the whole page is calculated for. Three switches above the calendar change how the range is picked:
- Days — the range is picked day by day: the first click sets the start, the second one sets the end.
- Weeks — a click selects a whole week; clicking another week extends the range.
- Months — the same, with a calendar month as the unit of selection.
Switching between Days, Weeks and Months resets the range you have already picked and substitutes a new one: Days — today with no end date, Weeks — the current week in full, Months — the current month in full. Choose the mode before you mark the dates, not after.
Which day the week starts on is defined by the company setting The first day of week. The same setting drives the order of columns in the Average workload by day of the week chart and in the meeting-room heat map.
The period is limited to three months. Pick a longer one and a warning appears under the calendar — The reporting period cannot be longer than three months — and the Save button becomes inactive — such a range cannot be applied. The limit exists because the calculation runs per place and per day of the period: on long intervals it becomes too heavy.
By resources
This filter answers the question of which resources get into the analytics — that is, which desks, parking places, meeting rooms and lockers are counted in the denominator of every percentage. In PACS mode the By office option also selects the entries — see below. Four options:
| Option | What is included | How it is picked |
|---|---|---|
| All | Every resource in the company. The default value | No extra fields |
| By department | Resources assigned to the selected department and all of its child units | The Select department field opens the org structure tree |
| By group | Resources available to the selected user group | A list of groups; the number of employees in the group is shown in brackets. The system group of all company users is not listed |
| By office | Resources of the selected office and all nested spaces | The Select office field opens the spaces tree |
In By data → PACS mode the By office option narrows not only the set of places but also the entries: only events assigned to the selected office or to the spaces inside it are counted. Events without an office — including all events stored before 5 October 2026 — are left out, so for such periods analytics with this option comes out as zero. The Attendance and Office potential blocks depend on this as well. The By department and By group options do not select entries. More in By office analytics: PACS data.
If you pick anything other than All, the value is mandatory: until a department, a group or an office is selected, Save will not close the window and the field is highlighted.
An important limitation. With By department selected, analytics for meeting rooms and lockers is not built: both tiles go grey and read This resource is not in use. The reason lies in how the product works — meeting rooms and lockers are not assigned to departments, so there is nothing to filter them by. Desks and parking are still calculated normally. To see meeting room or locker analytics, switch back to All, By group or By office.
Who can use the options. The By department, By group and By office switches in this section are active only for an employee whose card has Subordinates set to All users. Everyone else has All only, and the circle of people is limited by the By employees section.
By employees
This filter answers the second question — whose bookings and visits to count. The four options are the same: All, By department, By group and By office. The difference from the previous filter is that here you select people, not resources: By office, for example, means employees whose assigned office is this one, not everyone who booked a place in it. For an employee without the All users option two of the options are named differently: the first one is By subordinates instead of All, and instead of By group there is By team with a Select team field that lists that employee’s teams only.
The two filters work together and answer a compound question. Resources by office New York combined with employees by department Sales shows how the sales team used the New York places specifically.
Which options are available. An employee with the All users option can pick any of the four. For everyone else the set depends on how their subordinates are assigned:
- By subordinates — always available and selected when the page opens. The circle is assembled by the system itself: employees from the Subordinates list, those who have this employee in the Manager field, members of their teams and employees of the departments they manage. The manager is part of the circle as well: their own bookings and entries are counted alongside the subordinates. Nested departments where they are not the manager are not part of the circle.
- By department — available if the employee is the manager of at least one department. In the org structure tree only their departments together with the nested ones are active; the other branches are inactive. No department is substituted automatically — it is picked by hand. Picking a nested department does not widen the circle: only direct subordinates from that department are counted.
- By team — available if the employee has at least one team; the list contains their teams only.
- By office — available with the All users option only.
By data
The data source switch. Two values:
- Bookings — analytics is built from bookings made in UnSpot. The default value; all four tiles are available.
- PACS — analytics is built from actual entries recorded by the physical access control system. Only the Desk tile is available; parking, meeting rooms and lockers go grey and read No data for this resource.
PACS mode also changes the set of chart segments: instead of four (available, booked, assigned, unavailable) only two remain — available and booked. The mode itself, uploading the events and the counting rules are covered in a separate article about PACS data.
The PACS option is available to an employee with Subordinates set to All users or to the manager of at least one department. An employee whose subordinates are assigned only through a list, the Manager field or a team has the Bookings option only.
Description of the built analytics
A four-part line is always shown under the page title. It states which analytics is currently built, so you do not have to open the filter window to recall the settings. The same line is repeated at the bottom of the Build analytics window.
| Part of the line | What is substituted |
|---|---|
| Analytics is built for the period | The selected date range and the number of working days in it: Wed, July 8 – Tue, August 4, working days: 20 |
| and shows how resources from | The name of the department, group (with the number of employees) or office taken from the By resources filter; for a nested office the parent space is added after a slash. With All selected it reads the entire company |
| were used by employees from | The same for the By employees filter. For an employee without the All users option, By subordinates reads all subordinates |
| based on | bookings or PACS |
The working days counter follows the company public holiday calendar: every day of the period is checked against the calendar, and if there is no record for a specific date, the general weekday rule applies. This number matters because working days form the denominator of every workload percentage — weekends and public holidays are excluded from the calculation.
If By department, By group or By office is selected but the value itself has not been set yet, the corresponding part of the line turns grey and shows a hint — select department, select group (for an employee without the All users option — select team) or select office.
The same information goes into the header of every CSV file exported from this page: a Filters block with the For the period, By resources, By employees and By data rows. Thanks to that, an exported file always states the period and the selection it was built from.

All filters in one table
| Filter | Options | Limitations | What it affects |
|---|---|---|---|
| For the period | A calendar plus the modes: • Days • Weeks • Months | Three months maximum. Changing the mode resets the selected range | Every tile and chart. Sets the number of working days — the denominator of the workload percentages |
| By resources | All • By department • By group • By office | By department disables meeting rooms and lockers. Without the All users option only All is available | The set of resources: how many places, rooms and cells are counted. In PACS mode By office also selects the entries |
| By employees | All (By subordinates without the All users option) • By department • By group (By team without the All users option) • By office | Without the All users option: By department — only for a department manager and only within their departments, By team — only when teams are assigned, By office is unavailable; direct subordinates only are counted | The set of people: whose bookings and entries are counted, and the Attendance block |
| By data | Bookings • PACS | In PACS mode only the Desk tile is available. PACS is available with the All users option or to a department manager | The data source and the number of chart segments: four against two |