Product updates
26-02-2026
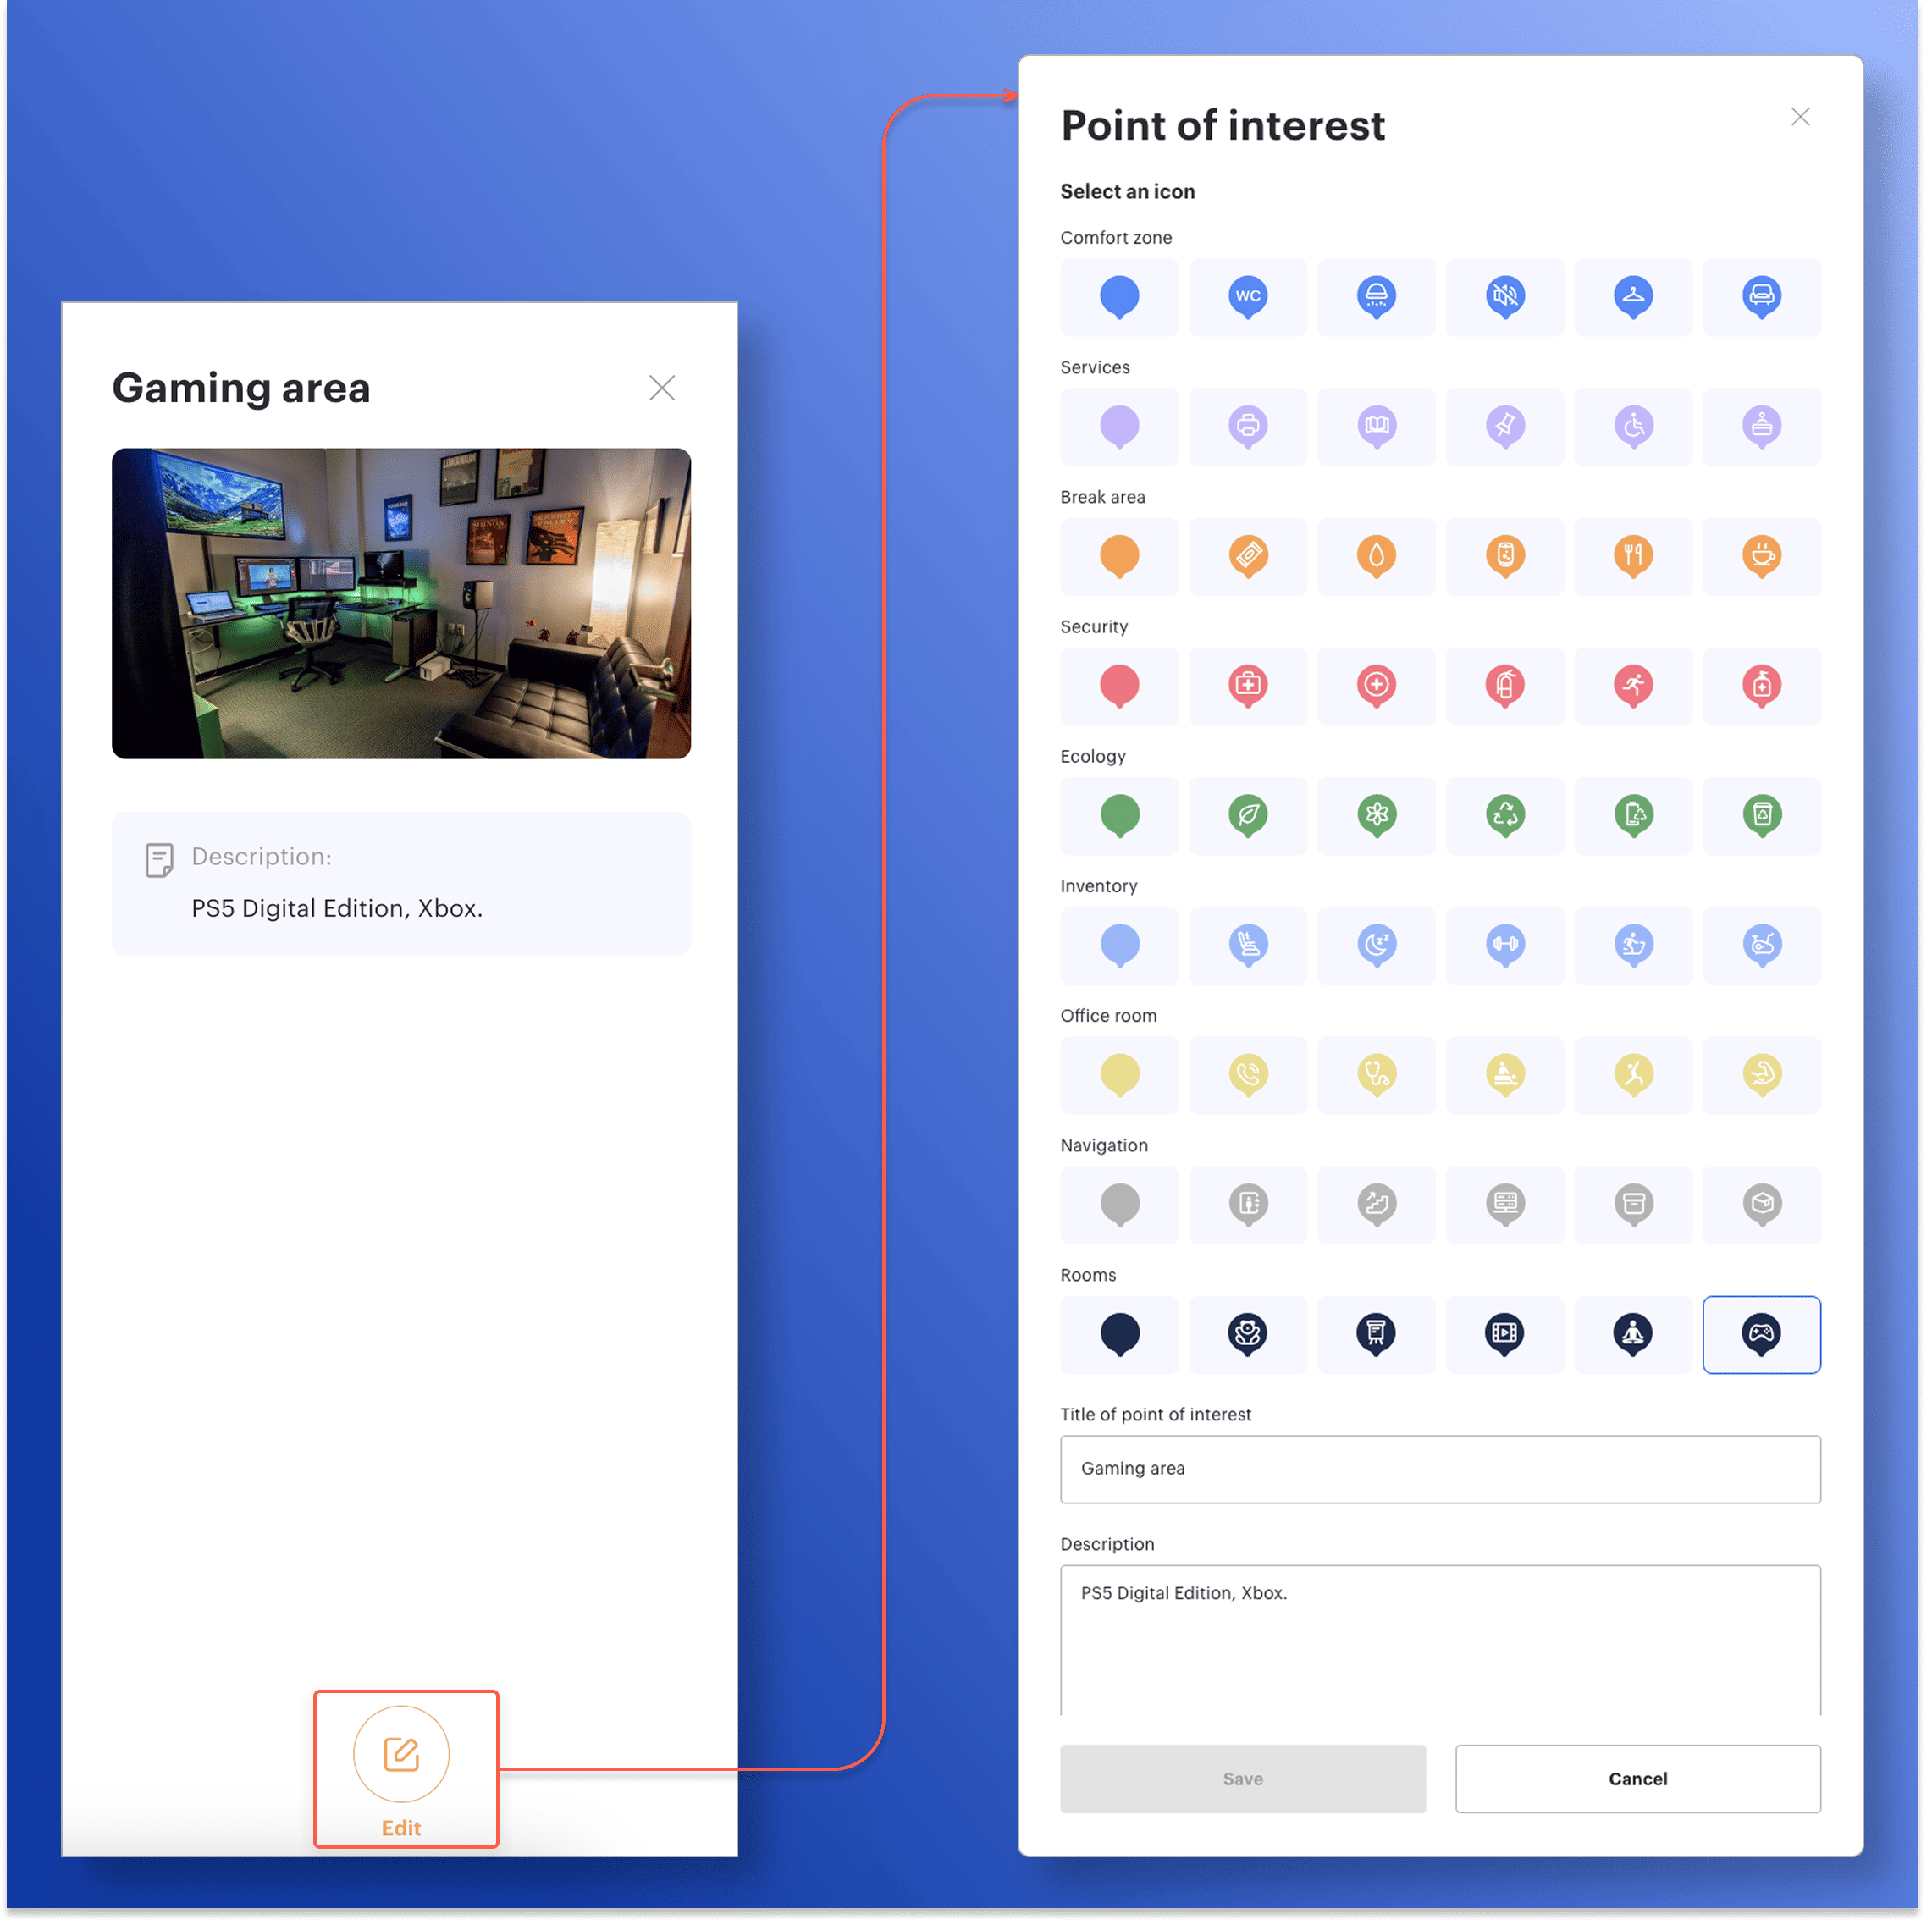
Editing points of interest directly from the object card
Now you can edit points of interest (POI) directly from the object card without switching to map edit mode. In the sidebar, administrators now have an Edit button that opens the edit window and lets them make changes right away.
This speeds up working with objects: to update a title, description, or icon, you no longer need to switch to a separate mode and search for the required point on the map again — changes are made “on the spot,” and after saving, the card immediately displays the updated data. As a result, keeping office map information up to date has become easier and faster.
18-02-2026
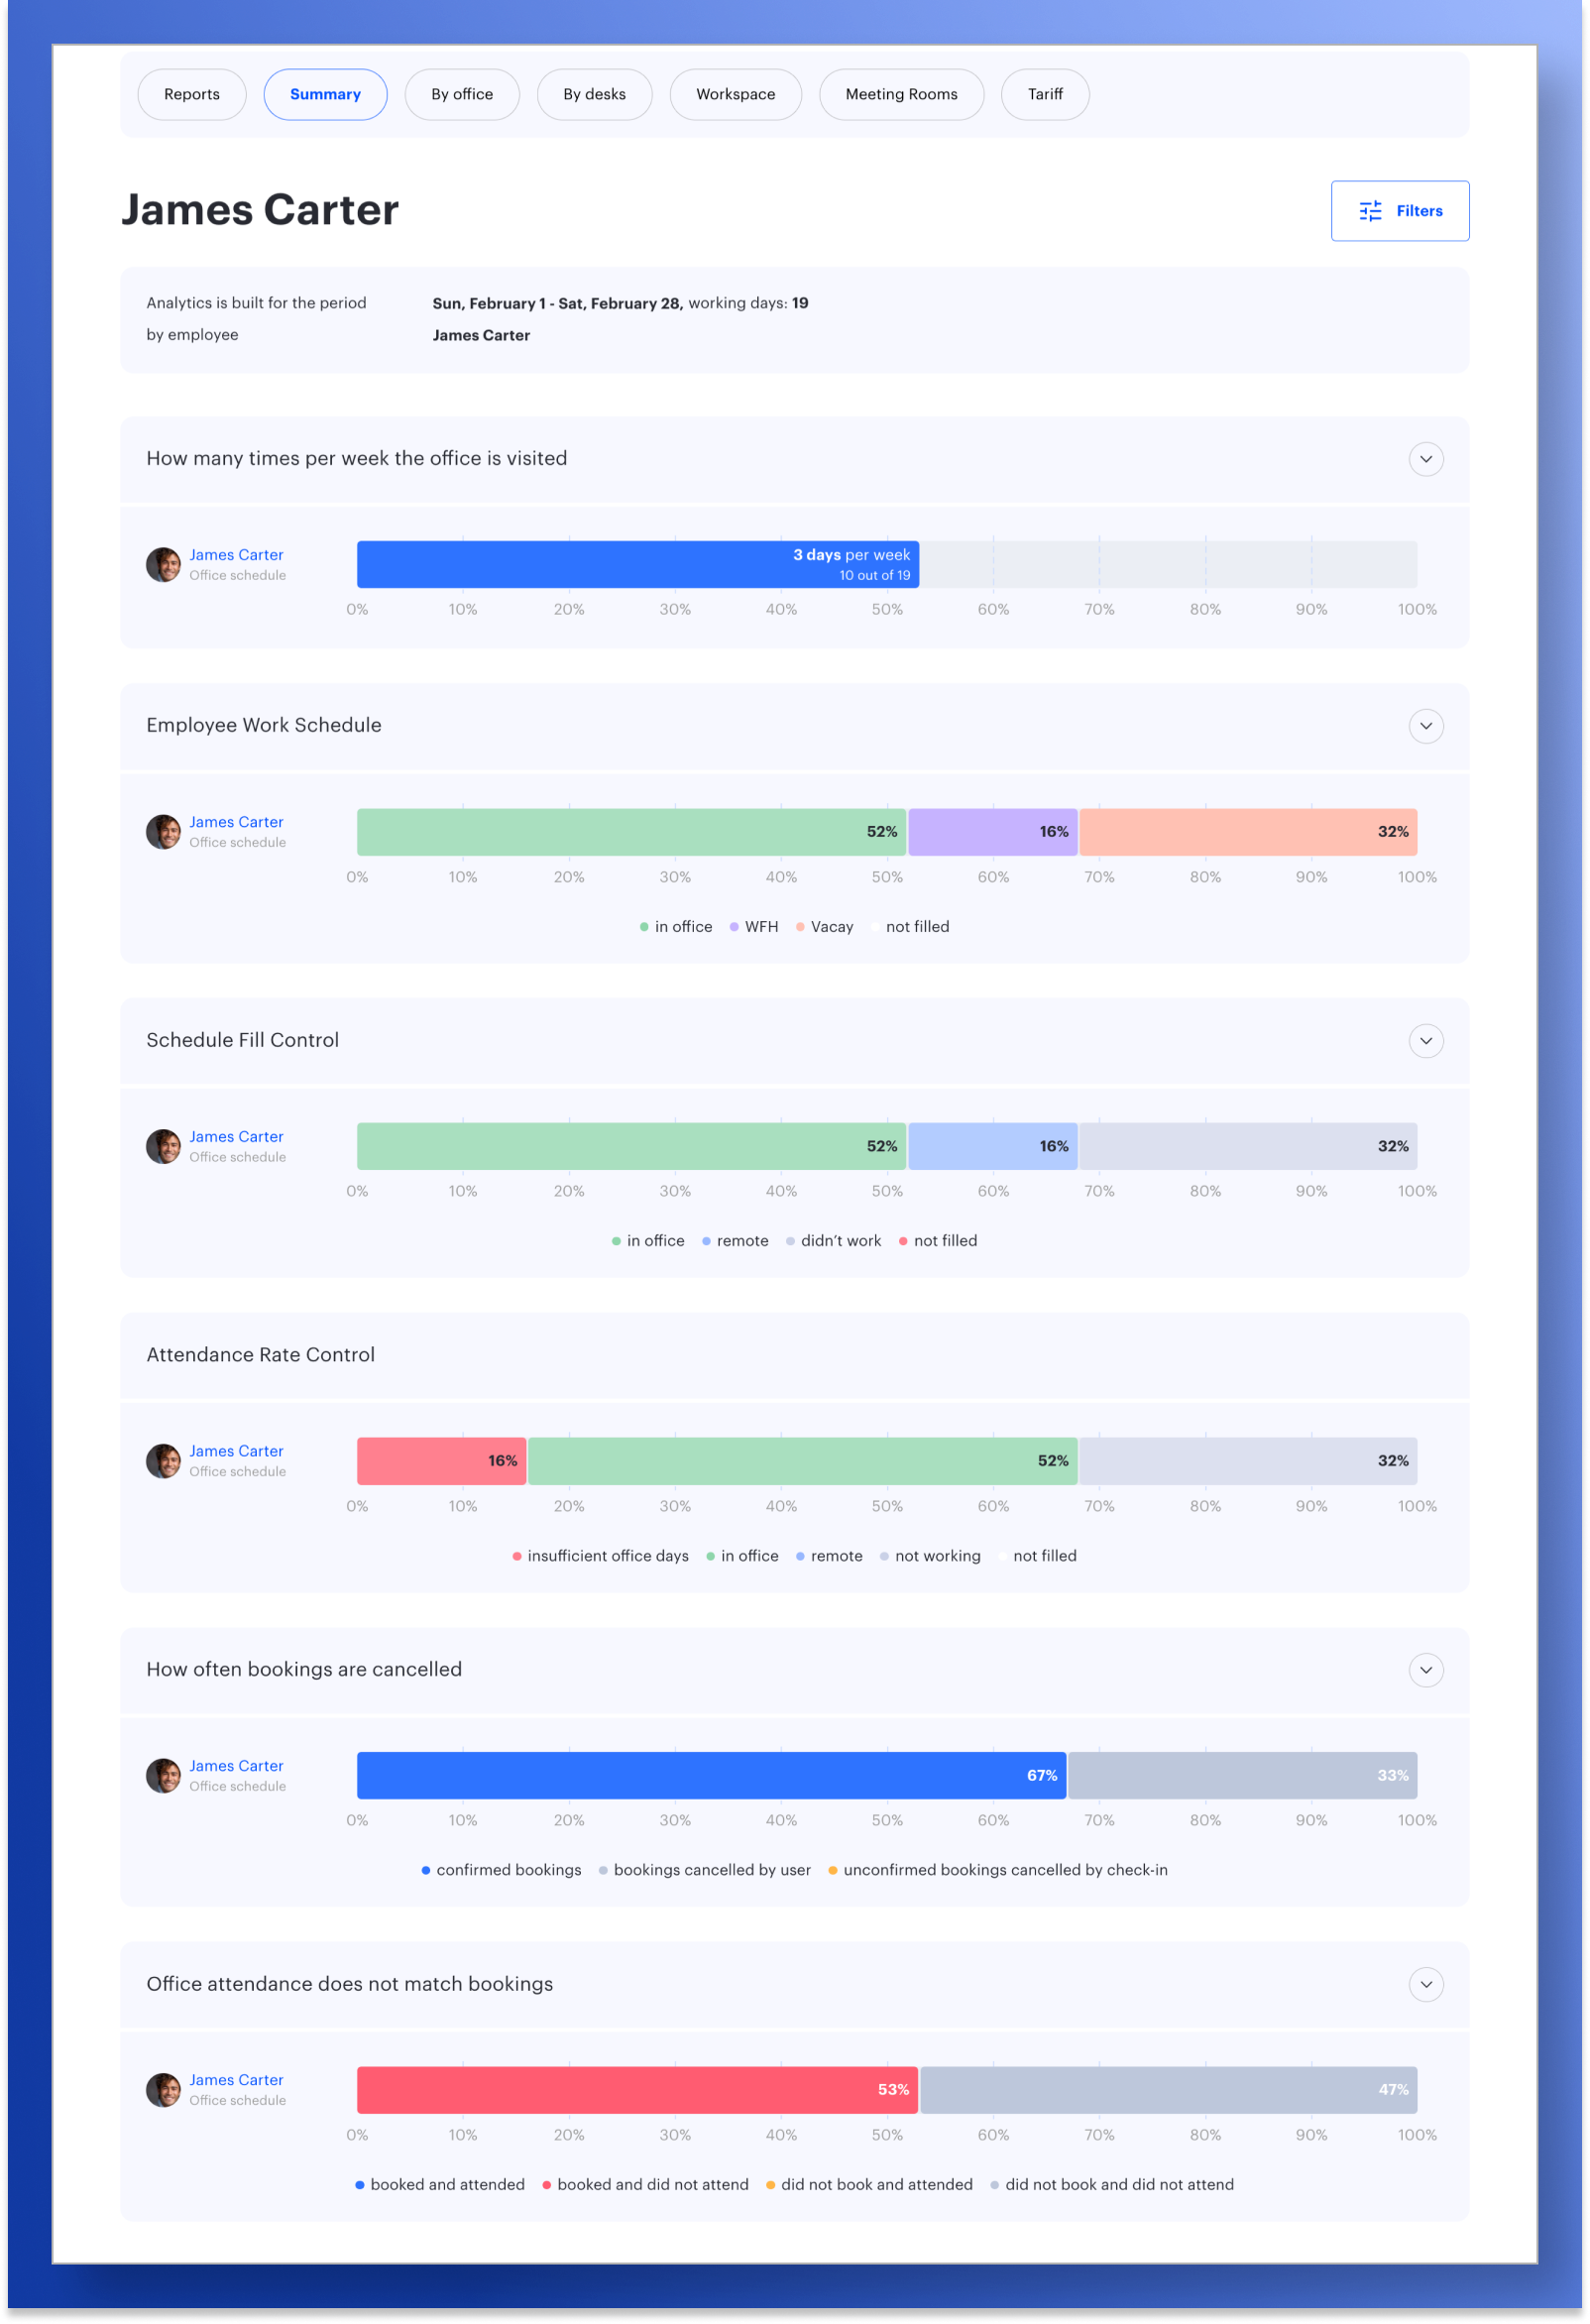
Employee Analytics Summary
UnSpot has introduced a new employee-level analytics page, “Overview”, which brings together six analytical charts covering key metrics related to schedules, bookings, and actual office attendance. It allows users to quickly understand how employees work and use the office — both for themselves and for their teams.
- “How many times per week the office is visited” shows how often an employee comes to the office, including the number of days with bookings and the average weekly attendance. This helps identify real attendance patterns and compare them with expectations.
- “Employee Work Schedule” displays statistics on working days based on the configured work mode — in the office, remote, or not working — helping to understand which work modes are used most often.
- “Schedule Fill Control” helps monitor how accurately an employee’s schedule is filled in.
- “Attendance Rate Control” shows whether the defined office attendance requirements are being met. It clearly highlights underutilization and deviations between actual behavior and the assigned work mode.
- “How often bookings are cancelled” displays confirmed bookings as well as cancellations made by users or by the system, helping assess how consistently office work is planned.
- “Office attendance does not match bookings” compares planned bookings with actual office visits, highlighting where office space is used efficiently and where discrepancies occur.
The data presented on this page makes it easier to detect scheduling issues, inefficient office usage, and gaps between planning and actual attendance, supporting more informed management decisions.
18-02-2026
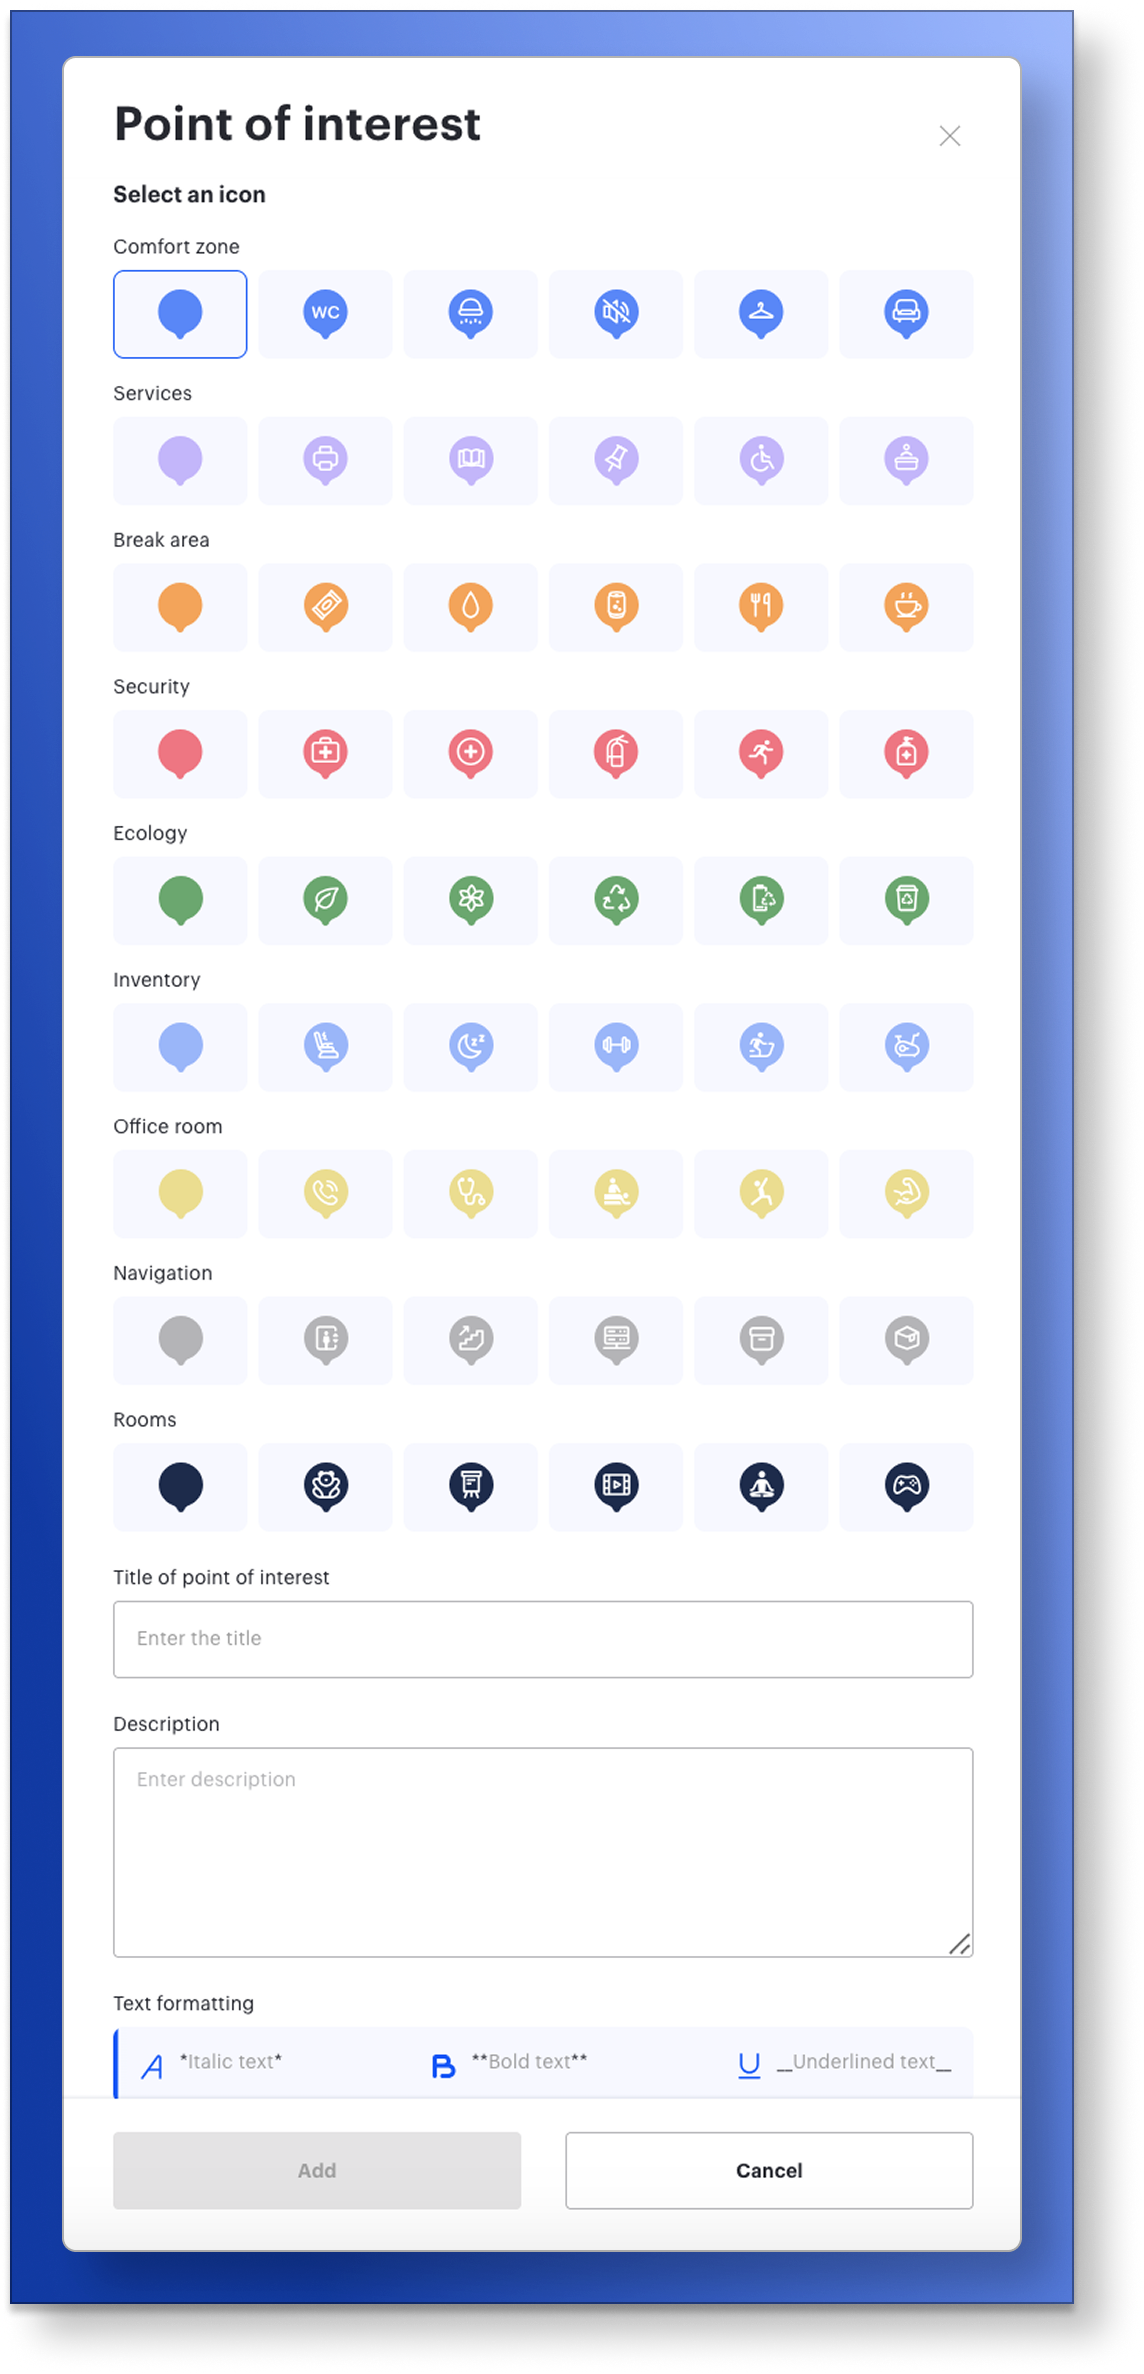
New Points of Interest on the Interactive Map
We’ve made working with map objects more convenient by updating the POI (Points of Interest) add and edit window and expanding the set of icons used to represent spaces and services.
Icons are now grouped into clearly labeled categories, the selection has been expanded, and choosing the right option takes less time. The updated icons are displayed correctly both in the editor and on the map, while existing objects do not require any reconfiguration.
The modal window has been improved for working with larger amounts of data: content scrolls inside the window, while key controls remain always visible. This makes editing descriptions easier and helps apply changes more quickly.
As a result, keeping the office map up to date has become faster and simpler, with clearer object labels and a consistent, clean map appearance for all users.
18-02-2026
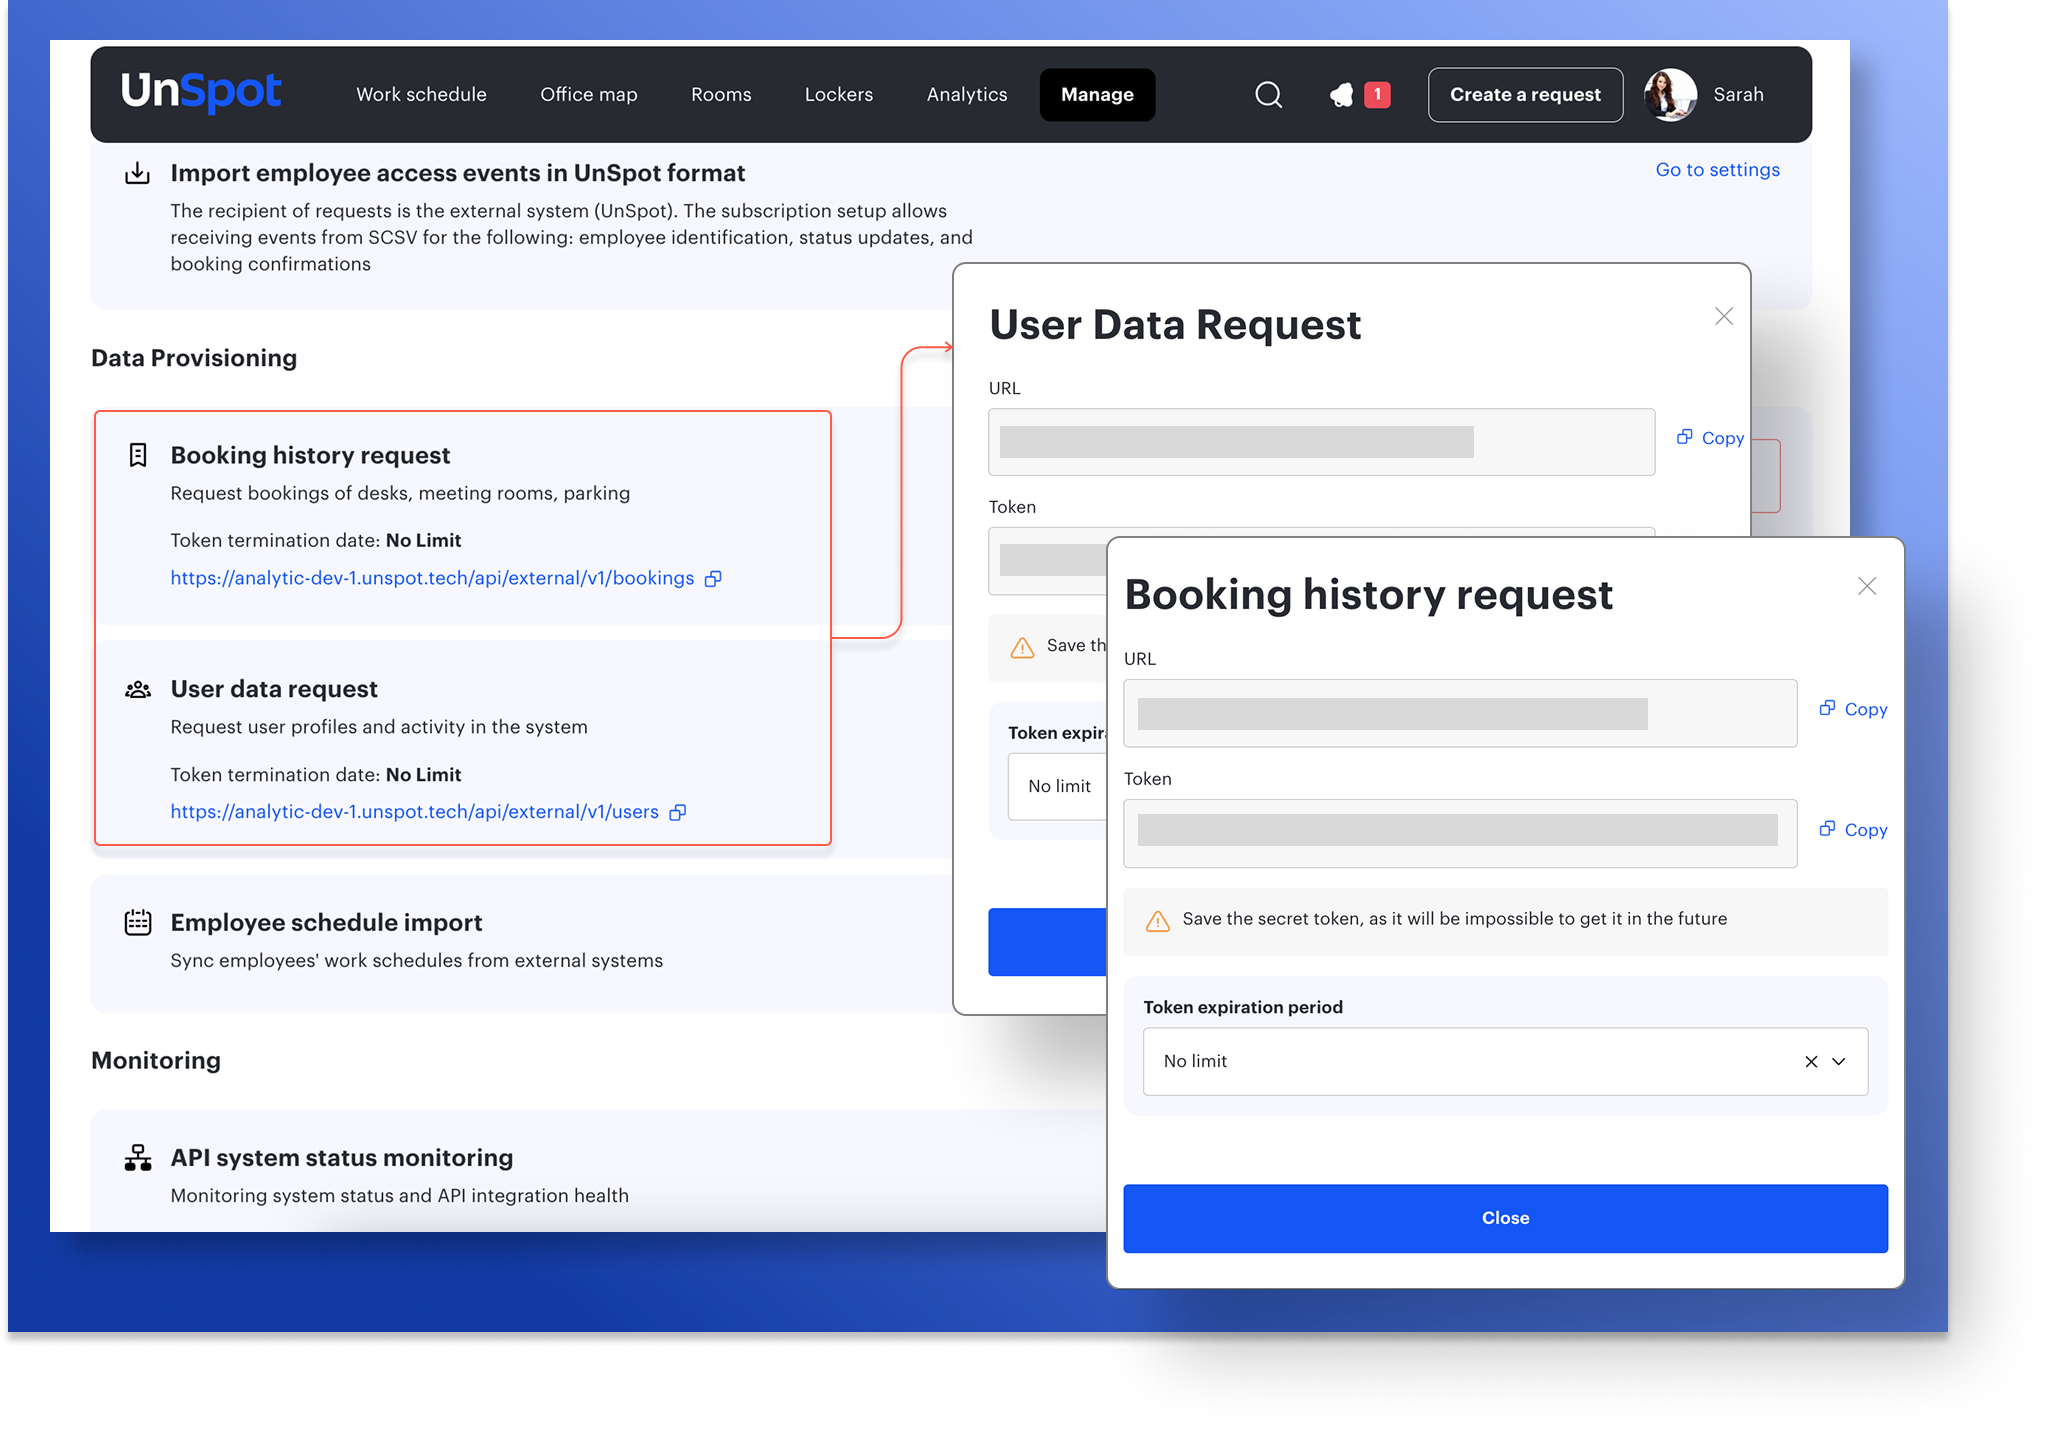
Company Portal Integration: Employee and Booking Data API
UnSpot now allows you to share data with external systems via API, making it easier to integrate the platform with corporate services and internal company portals.
Through the API, you can retrieve up-to-date employee information, including basic details, work mode, and current daily status — whether the employee is in the office, working remotely, or not working today. This data can be used to display employee status on a corporate portal without needing to open UnSpot.
Booking data for desks, meeting rooms, and parking spaces is also available. External systems can retrieve information about actual bookings for a selected period and use it for analytics, reporting, or synchronization with internal company tools.
As a result, companies gain a centralized and convenient way to work with employee and booking data, automate data exchange between systems, and improve transparency across internal processes.
18-02-2026
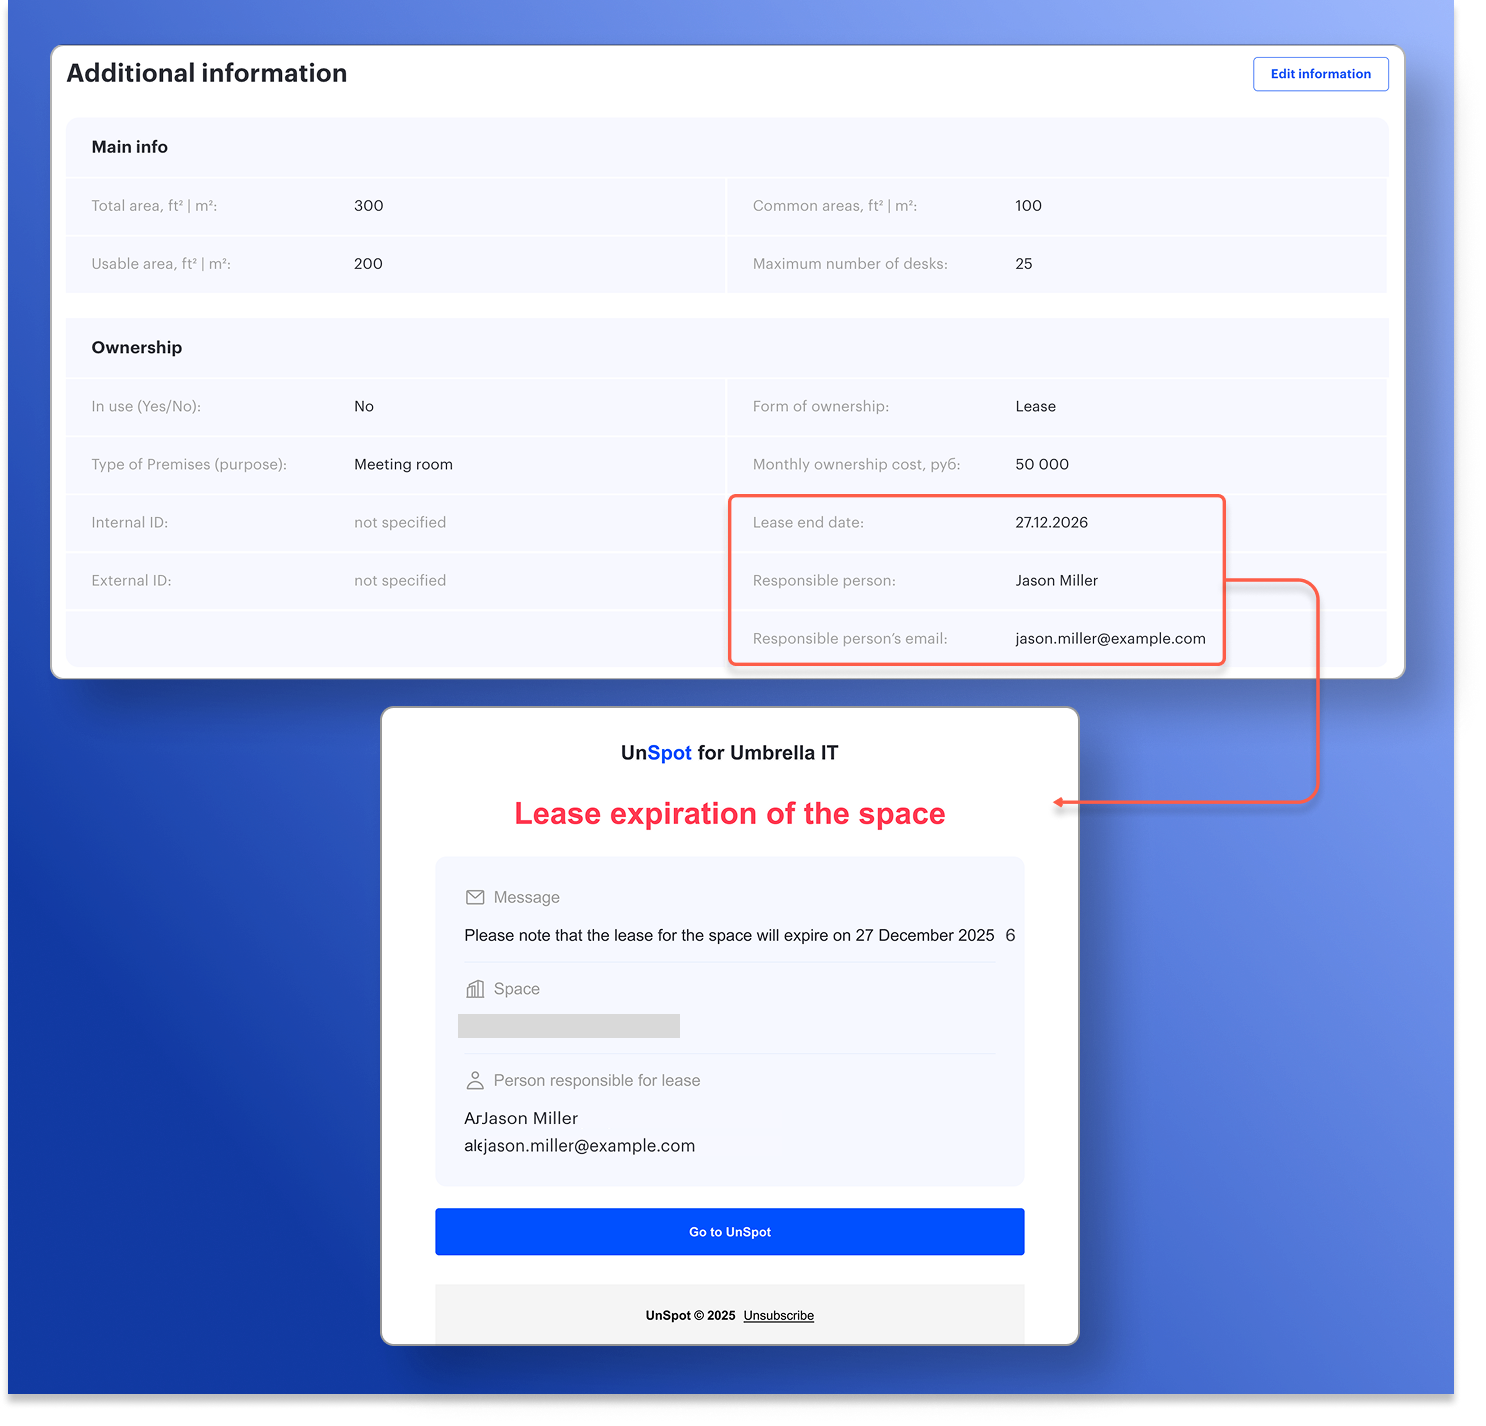
Office and Meeting Room Lease Control
Tracking office and meeting room leases no longer requires manual control.
A lease end date and responsible contact details have been added to the Inventory Information section in office and meeting room settings. This information is also included in inventory reports, providing a single, up-to-date source of lease-related information.
To help companies avoid missing important deadlines, a lease expiry notification subscription has been introduced. The system automatically sends email reminders 30, 21, 14, 7, and 1 day before the lease end date to all specified email addresses, including external ones. Each notification clearly indicates the space in question and the assigned responsible person.
As a result, companies have instant access to actual lease information for offices and meeting rooms, along with timely reminders — eliminating the risk of missing critical dates.